These 10th grade solubility curve worksheets pdf give chemistry teachers a ready set of graph-reading and calculation exercises built around the substances students encounter most often: potassium nitrate, sodium chloride, ammonium nitrate, and potassium chlorate, all plotted across the standard temperature range of 0°C to 100°C. Each worksheet stands alone as a focused practice tool — some centered on identifying saturation states, others on precipitation calculations, others on comparing the behavior of solids versus gases in solution.
Skills These Worksheets Build
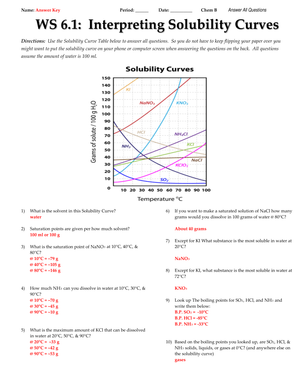
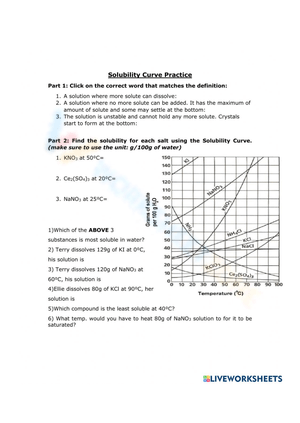
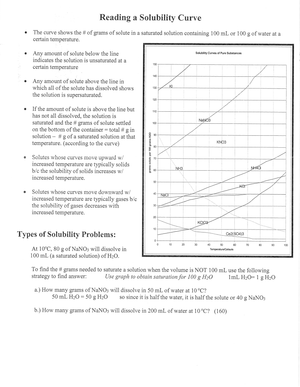
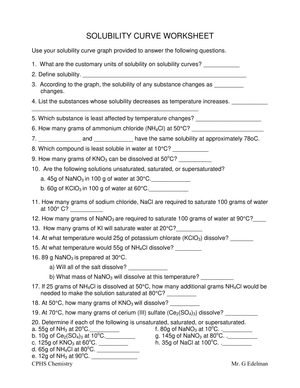
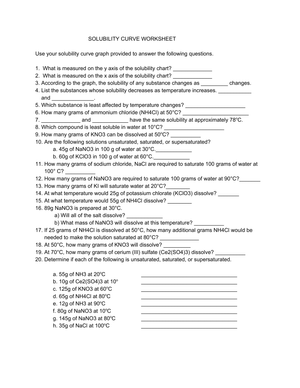
The foundational task across the set is locating a coordinate on the graph and classifying the solution state. Students plot a point — say, 80 grams of KNO₃ dissolved at 40°C — and determine whether it falls exactly on the substance's curve (saturated), below it (unsaturated), or above it (supersaturated). That three-zone classification is the entry point for every more demanding problem type.
From there, each worksheet moves into territory that requires real reasoning rather than simple graph reading:
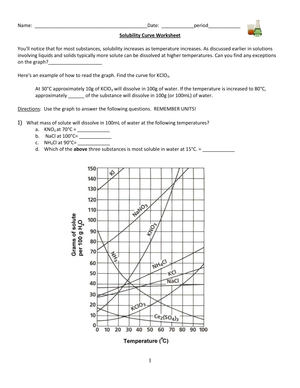
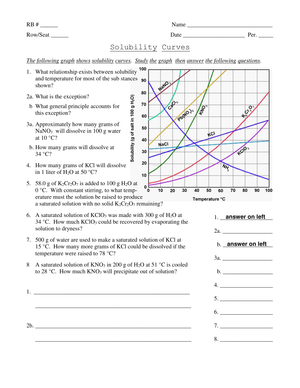
- Non-standard solvent volumes: Solubility graphs display grams of solute per 100g of water. Students who can read the graph at 100g still stumble when asked how much KNO₃ dissolves in 250g of water. Those problems require setting up a proportion from the graph-read value — a step that separates students who understand what the data represents from those who have only memorized a reading procedure.
- Cooling and precipitation: A saturated solution at 80°C is cooled to 20°C. How many grams of solute crystallize out? Students subtract the lower-temperature solubility from the higher-temperature value, but they must first read two separate points accurately from a graph that may have four or five intersecting lines.
- Slope comparison: Students contrast the steep rise of KNO₃ — roughly 13g per 100g water at 0°C versus about 170g at 80°C — against the nearly flat curve of NaCl, then explain in chemical terms what that difference means for how each substance behaves when heated.
- Gas solubility: One or two worksheets in the set include a downward-sloping curve for a dissolved gas, asking students to explain why oxygen becomes less soluble as water warms — connecting the graph's direction to the kinetic energy of gas molecules escaping the liquid phase.
Student Errors That Surface Almost Every Year
The above-versus-below confusion is the most persistent mistake at this level. Students learn the rule "above the curve equals supersaturated," but a significant number flip it — they reason that if the point sits above the line, the solution must have more room to dissolve, so it must be unsaturated. The reasoning is muddled, but the error is predictable. It helps to spend class time asking students to physically trace from their plotted point straight down to the x-axis and straight across to the y-axis before any independent classification work begins. That physical tracing step slows students down just enough to engage with what the coordinate actually means.
The second error appears in cooling problems. Students correctly read the solubility at the higher temperature and at the lower temperature, then stop — they report both numbers but never subtract. They have done the graph work without recognizing that the question asks for the change, not just the two readings. A brief whole-class worked example that explicitly frames the precipitate mass as the difference between those two values closes that gap for most students before they work on their own.
Multi-curve graphs create a third problem. When KNO₃, NaCl, KClO₃, and NH₄Cl are all plotted on one grid, students drift horizontally along a temperature line and accidentally read off the wrong substance's curve. Colored pencils and a ruler held vertically at the target temperature essentially eliminate this error — but students need direct instruction to adopt those habits, not just permission to use the tools.
Standard Alignment
These worksheets align directly with NGSS HS-PS1-3, which asks students to gather and interpret information describing how the bulk properties of substances relate to the electrical forces between particles. When a student reads that KNO₃ dissolves far more readily at elevated temperatures than NaCl does and connects that to differences in lattice energy, they are doing exactly the investigative reasoning HS-PS1-3 targets. The graph-analysis tasks in the 10th grade solubility curve worksheets pdf also align with the NGSS Science and Engineering Practice of analyzing and interpreting data — specifically, extracting quantitative information from a graphical display to answer testable questions about solution behavior. Most state physical science frameworks that address solution chemistry and dynamic equilibrium map onto these same skills, making the worksheets broadly applicable beyond strict NGSS districts.
How to Work These Worksheets Into Your Chemistry Unit
The most productive placement is the day after students first encounter the concept of saturation but before they begin quantitative stoichiometry with solutions. At that point, students understand what a saturated solution is in physical terms but haven't yet had to extract a number from a graph and carry it through a multi-step calculation. Starting with the classification worksheets — point on the graph, above or below or on the curve — takes about 15 minutes and gives immediate formative information about who is still confused about the axes before the more demanding precipitation problems arrive.
The precipitation calculation worksheets also work as a pre-lab activity before a crystallization experiment. Students use the 10th grade solubility curve worksheets pdf to calculate how many grams of potassium nitrate they will need to prepare a supersaturated solution, then verify those predictions at the bench. When a student's predicted crystal mass matches what they recover from a cooling beaker, the graph stops being an abstract number-extraction exercise. That connection is worth the 20-minute setup cost.
For a shorter use case, the slope-comparison and gas-solubility worksheets work well as a review task during the last 12 minutes of a Friday class — substantial enough to consolidate the week's concepts, contained enough that the majority of students finish before the bell.
Differentiating the Work Across Your Class
Students who are still shaky on coordinate graphing benefit from working with one substance at a time before facing a multi-curve grid. Set those students up with a single-curve KNO₃ worksheet, let them trace the curve in highlighter, and have them locate four or five points and classify them before introducing any calculation steps. Once the procedural confidence is there, the three-zone classification usually clicks faster than expected. The proportion step for non-standard solvent volumes — calculating for 50g or 200g of water instead of 100g — needs explicit instruction for these students rather than discovery.
For students who move through the standard problems without difficulty, the meaningful extension is cumulative crystallization. Give them a problem where a solution cools from 90°C down to 10°C and ask them to calculate, at each 10-degree interval, how many additional grams of solute would crystallize out. That builds a step-by-step table of precipitate mass, which connects naturally to recrystallization as a purification technique in organic chemistry. At that level of multi-step reasoning, the 10th grade solubility curve worksheets pdf become a genuine diagnostic — they show whether a student has internalized the graph as a model of solution behavior or simply learned to execute a reading routine.
Frequently Asked Questions
Do the worksheets include answer keys?
Yes. Each worksheet comes with a matching key that shows the specific coordinate readings used to generate each answer. For precipitation calculations, the key shows both solubility values read from the graph and the subtraction step explicitly, so teachers can identify exactly where a student's work broke down if their final answer doesn't match.
What should students already know before using these worksheets?
Students need to be comfortable reading a two-axis graph and should understand that a solute dissolves in a solvent. They do not need prior exposure to the terms saturated, unsaturated, or supersaturated — those terms are introduced and applied through the classification problems in the earlier worksheets. Students who have not yet encountered coordinate graphing will need additional support with the graph-reading mechanics before the chemistry content becomes accessible.
How long does a typical worksheet take to complete in class?
A classification-only worksheet takes most 10th graders 10 to 15 minutes. Precipitation calculation worksheets run longer — typically 20 to 25 minutes for the majority of the class, with some students needing extra time on the proportion step for non-standard solvent volumes. The multi-curve comparison worksheets fall in between, depending on how many substances are plotted on the grid.
Are these appropriate for use as a quiz or summative check?
The precipitation calculation and slope-comparison worksheets work well as brief summative checks at the close of a solution chemistry unit. The classification worksheets are better suited to formative use — they surface confusion quickly, but they don't carry enough complexity to distinguish students who have deeply understood the content from those who have learned a simple above-or-below rule. Using both types together gives a fuller picture of where students actually are before moving into solution stoichiometry.