


1 / 6
0
Views
0
Downloads


Save
0 Likes
Reading a Solubility Curve
0 Views
0 Downloads
Paste this activity's link or code into your existing LMS (Google Classroom, Canvas, Teams, Schoology, Moodle, etc.).
Students can open and work on the activity right away, with no student login required.
You'll still be able to track student progress and results from your teacher account.
Information
Description
What It Is:
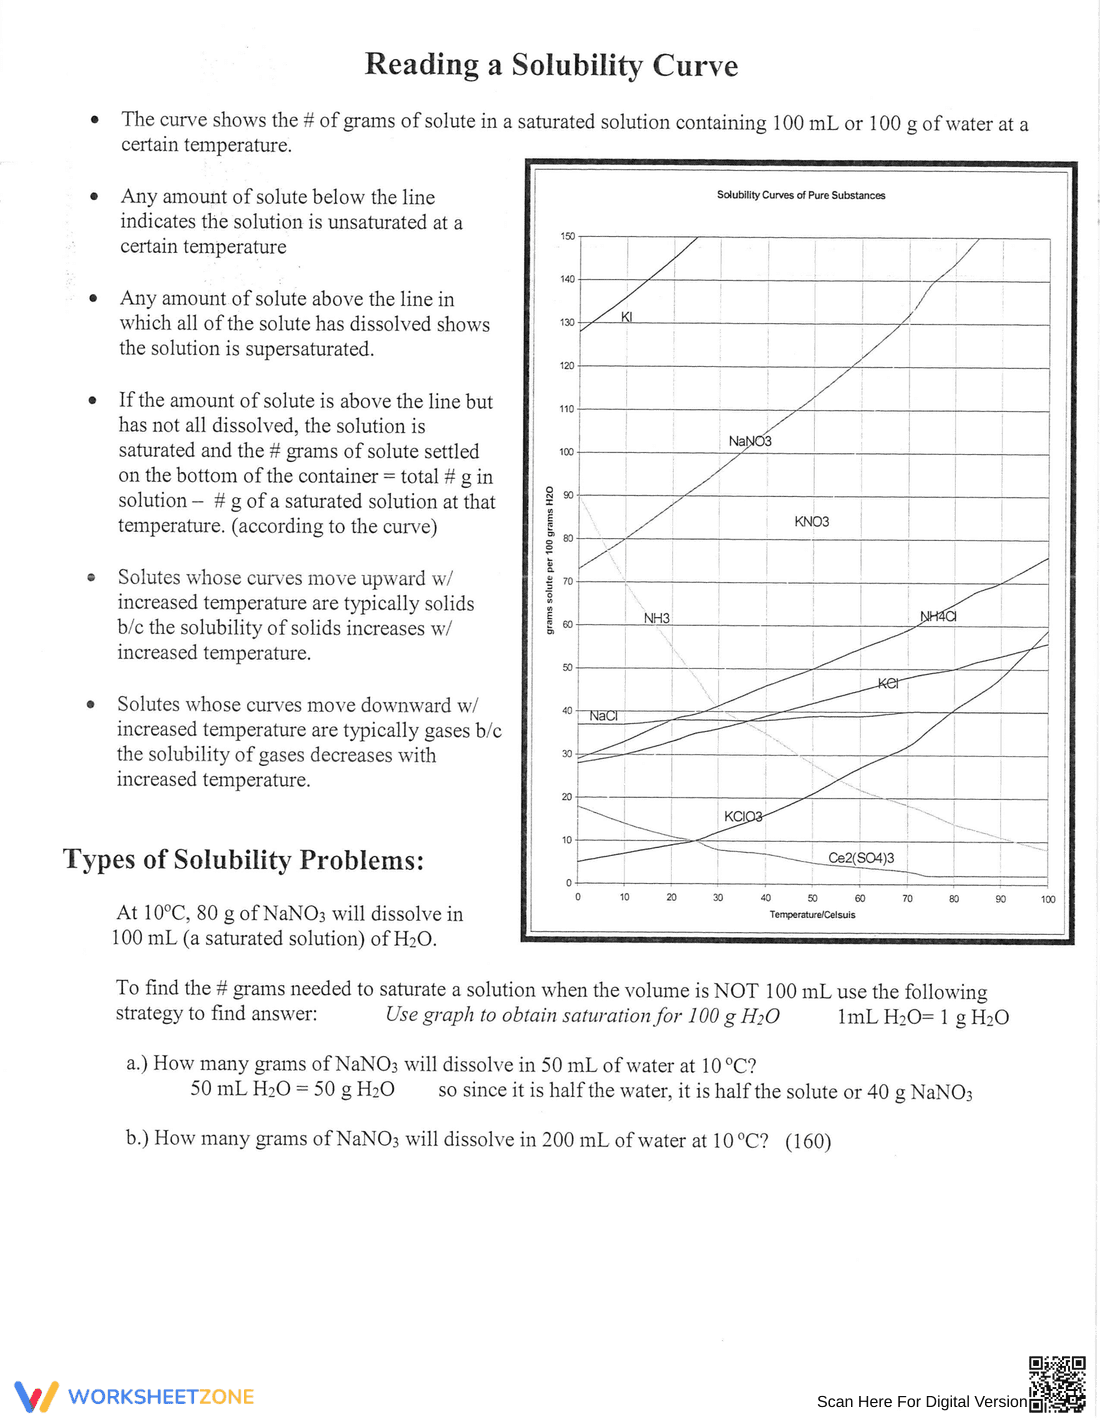
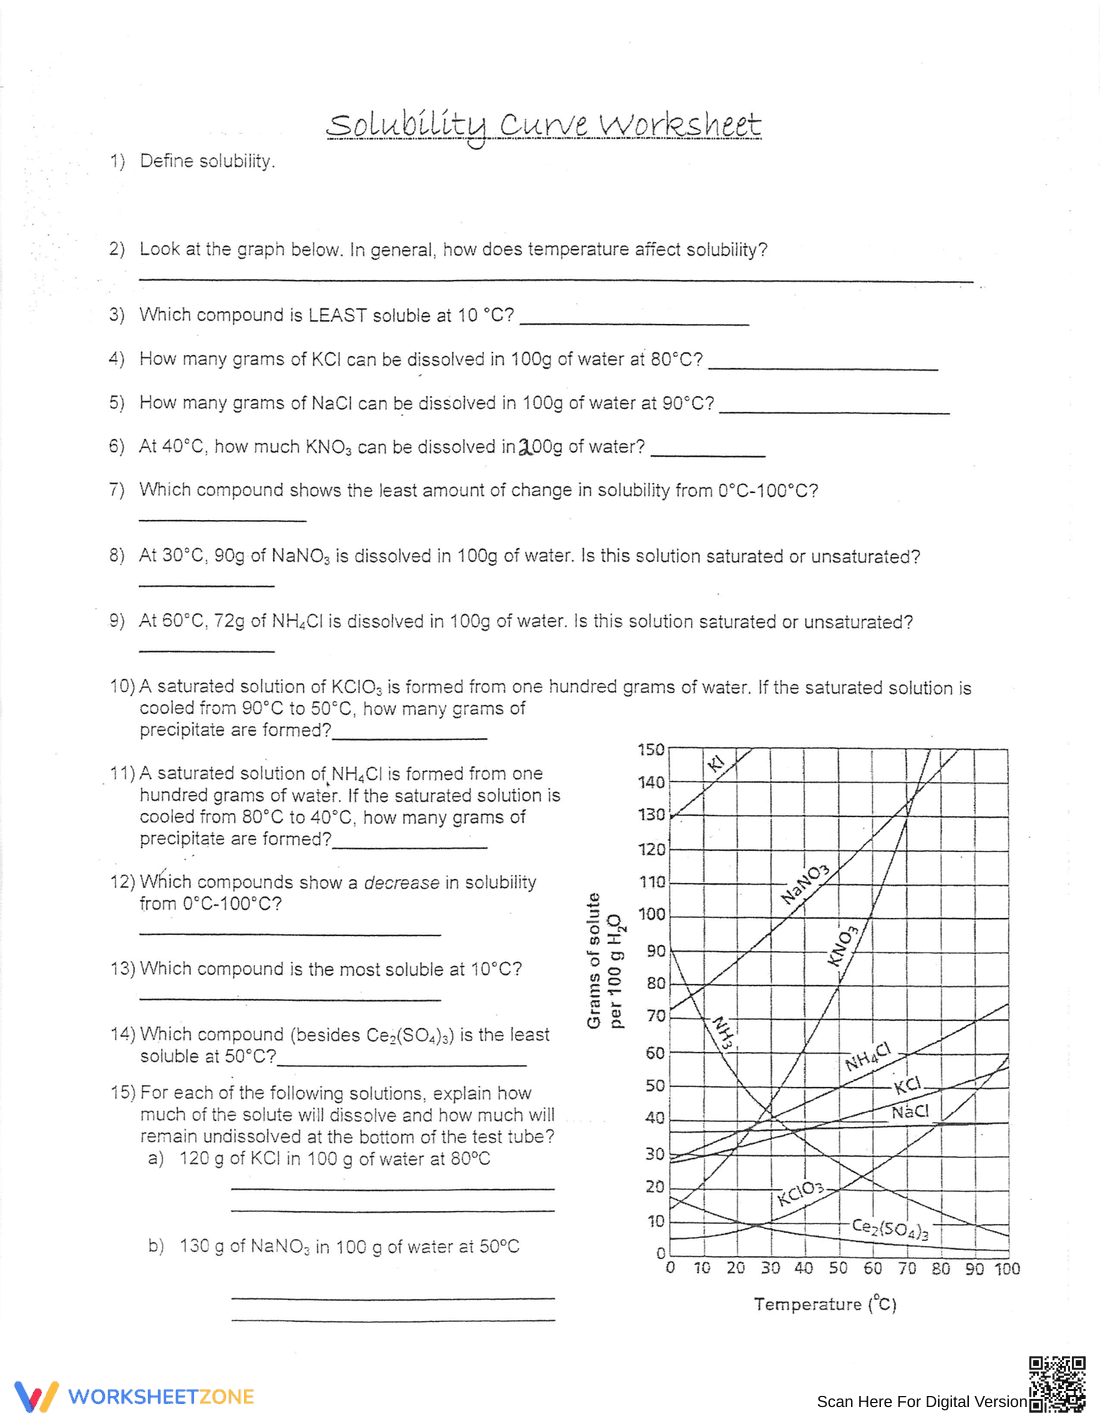
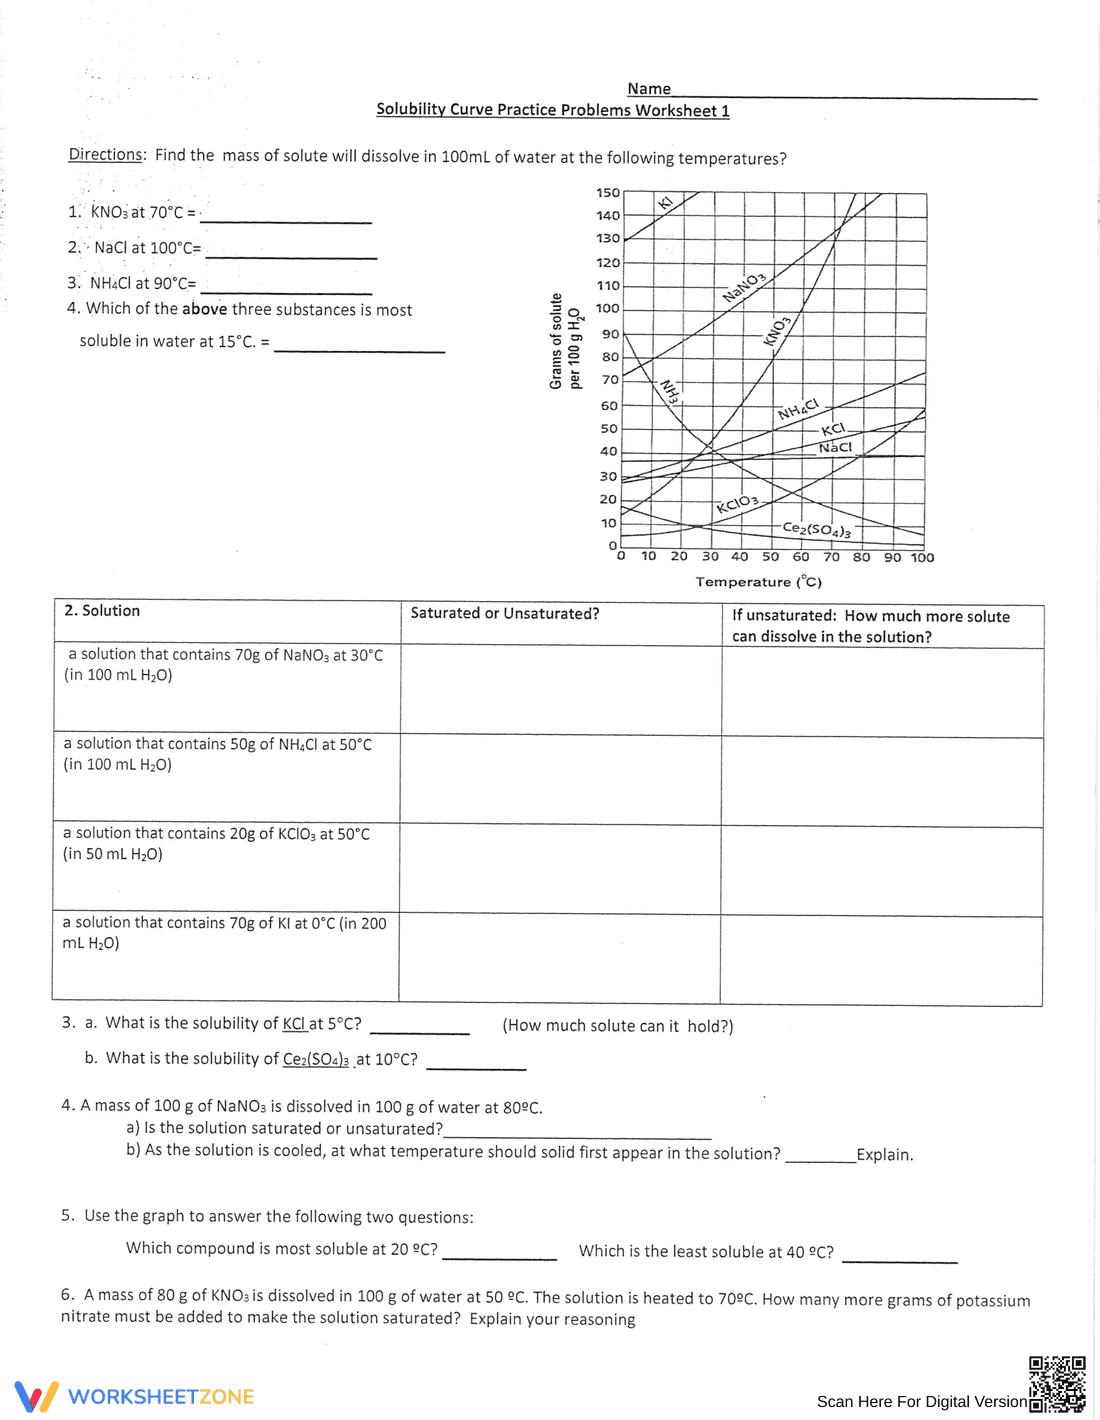
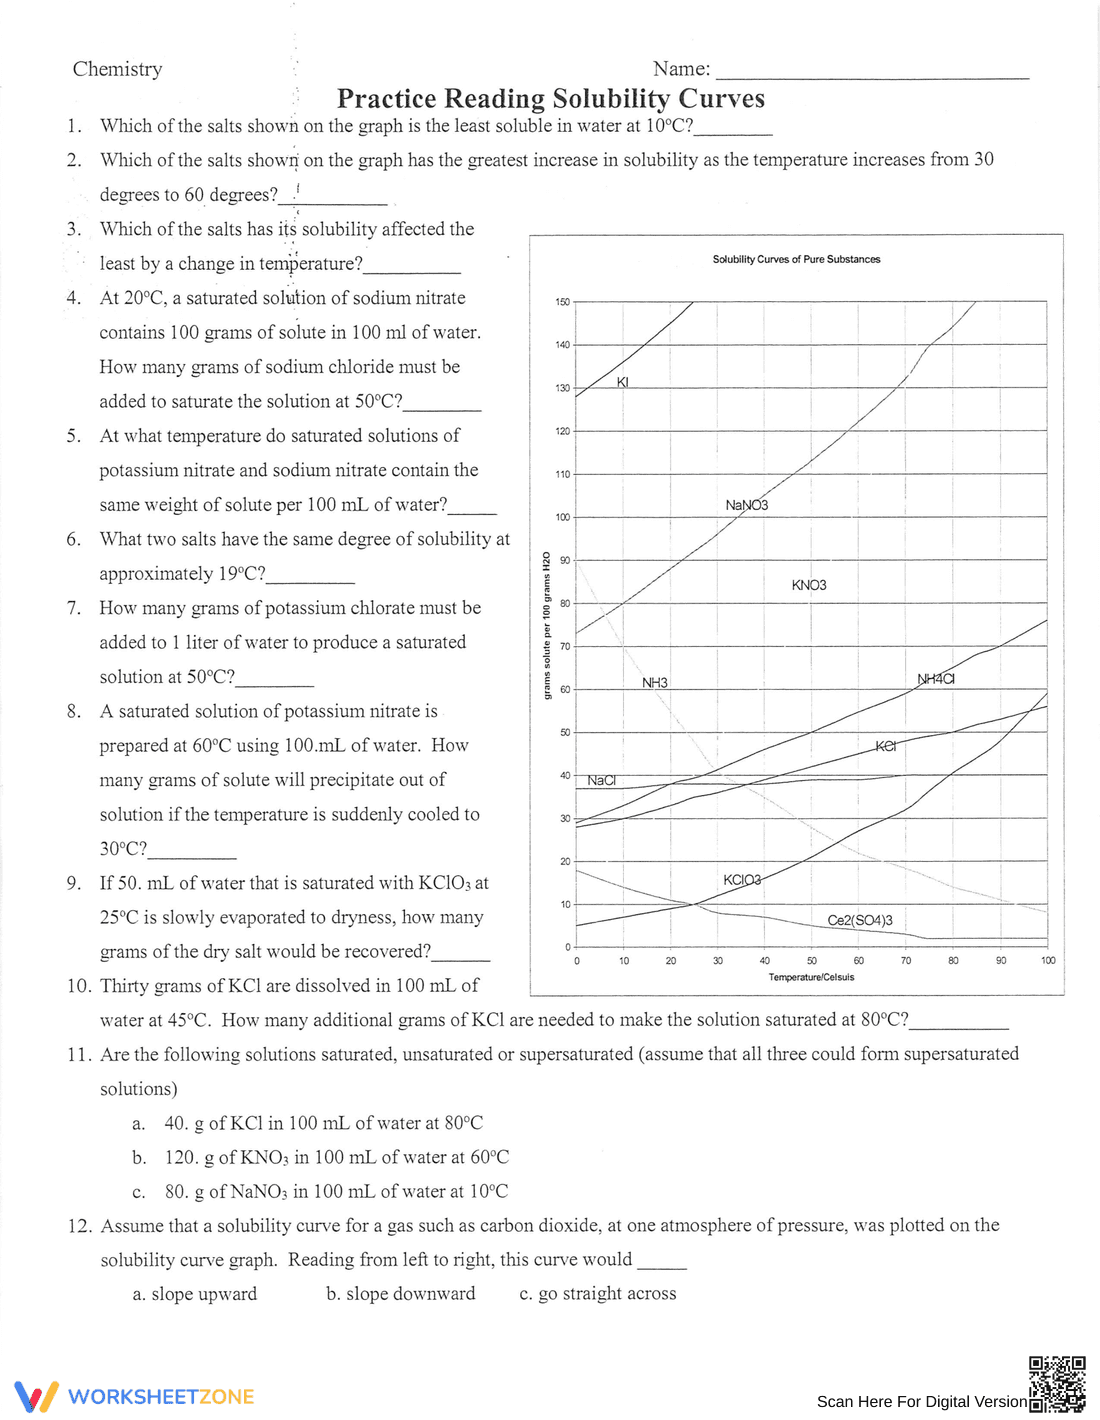
This is an educational worksheet focused on reading and interpreting a solubility curve. It provides a graph showing the solubility curves of various substances (KCl, NaNO3, KNO3, NH4Cl, AlCl3, KClO3, and Ca(OH)2) in relation to temperature. The worksheet includes explanations of how to interpret the graph, including what it means when a solution is saturated, unsaturated, or supersaturated. It also contains practice problems where students need to determine the amount of solute that will dissolve in a given amount of water at a specific temperature using the graph.
Grade Level Suitability:
This worksheet is suitable for grades 9-12, particularly for high school chemistry or physical science courses. The concepts of solubility, saturation, and interpreting graphs require a level of scientific understanding typically developed in these grades. The math involved is basic, but understanding the chemistry concepts is crucial.
Why Use It:
This worksheet helps students develop skills in interpreting graphical data, understanding the concept of solubility, and applying this knowledge to solve quantitative problems. It reinforces the relationship between temperature and solubility and provides a visual representation of the solubility of different substances. It also introduces students to the concepts of saturated, unsaturated, and supersaturated solutions.
How to Use It:
First, review the definitions and explanations provided on the worksheet. Then, use the solubility curve graph to answer the practice problems. For each problem, locate the relevant temperature on the x-axis, trace upwards to the curve for the specified substance (NaNO3), and then read the corresponding solubility (grams of solute per 100g of water) on the y-axis. Adjust the value based on the volume of water given in the problem (e.g., if the problem asks about 50mL of water, halve the solubility value).
Target Users:
This worksheet is designed for high school students studying chemistry or physical science. It is also useful for teachers looking for practice problems to reinforce the concept of solubility and graph interpretation. Students who are struggling with understanding solubility curves would benefit from working through this worksheet.