Why ABO Blood Types Are the Best Codominance Example
When your genetics unit moves past simple dominant and recessive traits, students need a concrete case where two alleles show up at the same time. ABO blood typing is that case. A person who inherits both the A allele and the B allele doesn't blend them into a middle phenotype and doesn't hide one behind the other. Both antigens appear on the red blood cells, and the result is type AB blood. That visible, testable outcome is why codominance blood types worksheets anchor so many high school genetics lessons.
For teachers, the appeal is practical. Blood type is something every student has, family conversations make it relevant, and the inheritance pattern is clean enough to model with a Punnett square in one class period. Unlike abstract pea-plant examples, it connects genetics to a trait students can actually look up on a blood donor card. It bridges the gap between the two-allele traits students meet first and the messier reality of human genetics.
The Three Alleles Behind Blood Type Inheritance
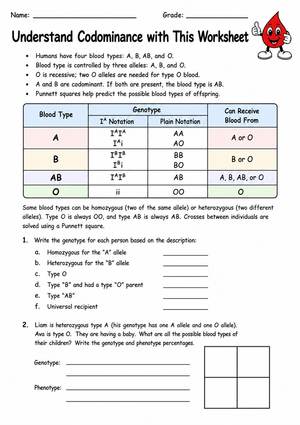
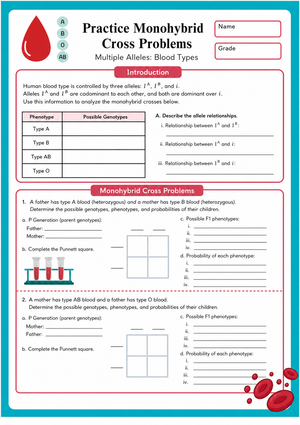
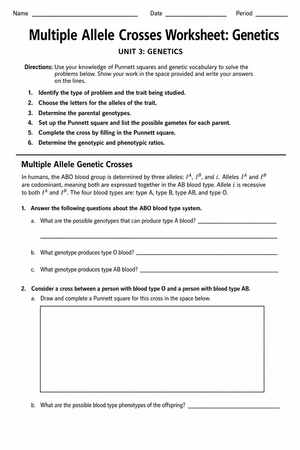
The ABO gene is a multiple allele trait, which means one gene has more than two possible versions in the population. There are three: IA, IB, and i. Any individual still carries only two of them, one from each parent, but the population pool holds all three. IA and IB are codominant to each other, and both are dominant over i.
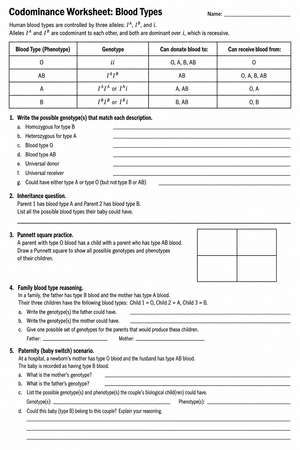
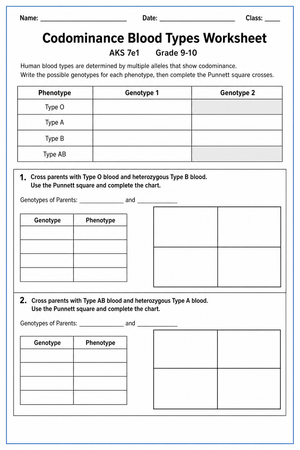
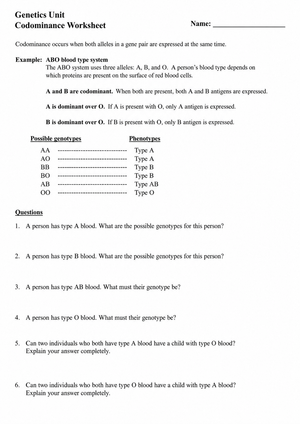
That combination produces four phenotypes from six genotypes. Type A comes from IAIA or IAi. Type B comes from IBIB or IBi. Type AB requires IAIB, and type O only appears with ii. Getting students to list all six genotypes and sort them into four blood groups is often the first worksheet task, and it forces them to hold the codominance rule and the recessive-i rule in mind at the same time.
A useful framing is that the i allele codes for no functional antigen at all, which is why it behaves recessively. IA and IB each add their own antigen to the cell surface, so when both are present neither can hide the other. That physical picture, antigens sitting together on the same cell, is what makes codominance click for students who have only seen dominance as one trait winning out.
Codominance vs. Incomplete Dominance vs. Simple Dominance
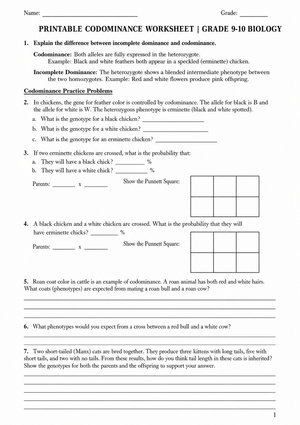
The most common confusion is between codominance and incomplete dominance, so it helps to separate the three patterns directly. In simple dominance, the dominant allele masks the recessive one and you see a single trait. In incomplete dominance, two alleles blend into an intermediate, the way red and white flowers can give pink. In codominance, both alleles are fully and separately expressed, so you see both traits, not a blend.
Type AB blood is the giveaway. The red blood cells carry A antigens and B antigens side by side, not a hybrid antigen. Pointing students to that distinction early prevents the classic error of describing AB blood as a blended mix of A and B.
Punnett Square Practice for ABO Genotypes
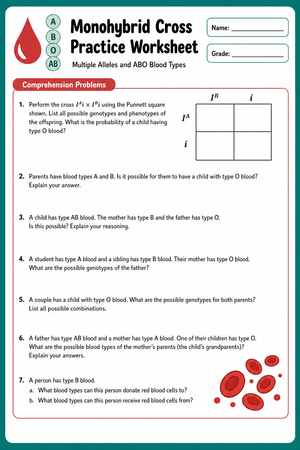
Once the alleles are clear, Punnett squares turn the concept into repeatable practice. A cross between an IAi parent and an IBi parent is a favorite because it produces all four blood types in a single 2x2 square: IAIB for AB, IAi for A, IBi for B, and ii for O, each at 25 percent. Students can predict phenotype ratios, then check whether a specific child's blood type is even possible given the parents.
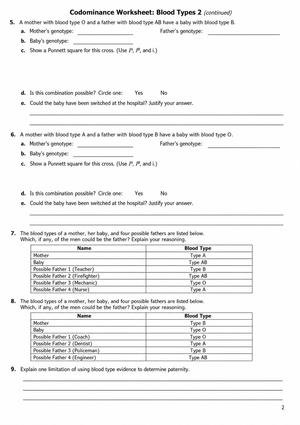
Worksheets usually build from single crosses to word problems, such as whether a type O child can be born to a type A parent and a type B parent. The answer is yes, but only when both parents carry a hidden i allele, and working that out cements why genotype matters more than phenotype in these problems.
To stretch stronger students, add reverse problems: give the children's blood types and ask what parental genotypes could produce them. These backward crosses are harder because several genotype combinations may fit, and they mirror the logic used in real paternity and forensic contexts, which keeps the practice grounded in something students recognize.
Using Real US Blood Type Data as an Extension
Distribution data turns a genetics lesson into a short population investigation that ties the worksheet to real numbers.
According to Statista's 2023 US blood type distribution data, O-positive is the most common type at about 38.4 percent of the population, A-positive follows at about 35.7 percent, and AB-negative is the rarest at roughly 0.7 percent, letting students test predicted phenotype ratios against real national frequencies.
Here's the angle most worksheets skip: blood type frequency is not uniform across US populations, and that variation is a teachable data point rather than a footnote. Reported distributions show about 53 percent of Latino Americans have O-positive blood compared with about 37 percent of Caucasian Americans. Asking students why allele frequencies differ between groups pushes them from single-family Punnett squares toward reasoning about whole populations, which is exactly the kind of data-driven thinking current science standards emphasize.
Classroom Implementation
A blood type worksheet works best when it is spread across a lesson instead of dropped in all at once. Try structuring it in three moves:
- Bell-ringer: Post one genotype, such as IBi, and ask students to name the blood type and explain which allele is hidden.
- Small-group stations: Give each group a different parental cross and have them build the Punnett square, then rotate so groups check each other's phenotype ratios.
- Exit ticket: Ask whether a listed child blood type is possible from two given parents, which quickly surfaces who still confuses genotype with phenotype.
Because the math is light, this sequence leaves room for discussion, and it gives you three separate formative checks from a single worksheet page. If you teach multiple sections, keep the station crosses identical so you can compare where different classes struggle.
Common Student Misconceptions to Watch For
Two errors show up every year. The first is treating AB blood as a blend, which is really incomplete dominance sneaking back in; remind students that both antigens are present and separate. The second is forgetting that type O demands two recessive i alleles, so students wrongly rule out an O child from A and B parents. A third, quieter mistake is writing genotypes as AB or AO instead of IAIB or IAi, which hides the allele notation the rest of the unit depends on. A quick worksheet item targeting each misconception is usually enough to correct all three before an assessment.
Frequently Asked Questions
1. How is ABO blood type an example of codominance rather than incomplete dominance?
In type AB blood, both A and B antigens are fully expressed on the red blood cells at the same time. Nothing blends into an intermediate, which is what would happen with incomplete dominance. Because both alleles show their own product, the ABO system is codominant.
2. What grade level and course usually cover codominance and blood type genetics?
These worksheets fit high school biology and dedicated genetics courses, typically during a heredity or inheritance-patterns unit. Some accelerated middle school programs introduce the idea, but the full three-allele analysis is most common in grades 9 through 12. By that stage students already know basic Punnett squares, so blood type serves as the bridge into more complex inheritance.
3. How can teachers use Punnett squares to teach ABO inheritance?
Start with a cross between two heterozygous parents, like IAi by IBi, which yields all four blood types at 25 percent each. From there, move to word problems that ask whether a given child's type is possible, so students reason from genotype rather than guessing from phenotype.
4. Why is the ABO gene considered a multiple allele trait?
One gene has three versions in the population: IA, IB, and i. Any single person still inherits only two, but because the population carries more than two alleles for the gene, ABO is a textbook multiple allele example, unlike the two-allele traits students study first.
5. How can real blood type data extend a codominance worksheet?
National distribution numbers, such as O-positive at about 38.4 percent and AB-negative at about 0.7 percent, let students compare predicted ratios with real frequencies and discuss why blood types differ across US population groups.