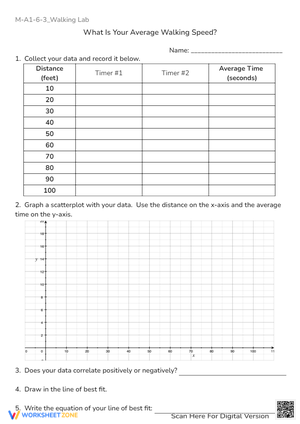
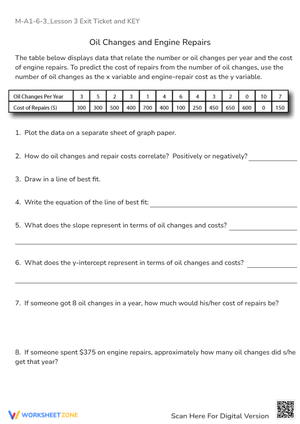
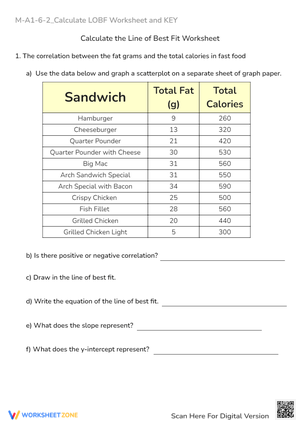
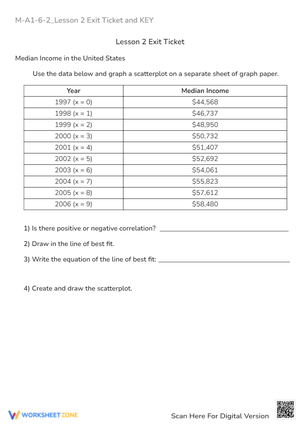
If you searched for line of best fit worksheets, you are probably planning the stretch of a grade 8 or Algebra 1 unit where scatter plots stop being a graphing exercise and start becoming a modeling tool. Students need to look at a cloud of points, decide whether a line makes sense, and then draw one that reasonably represents the trend. That is a visual and reasoning skill, not just a computation, and it needs repeated, well-sequenced practice to stick.
Line of best fit worksheets give you a low-prep way to deliver that repetition. Instead of building new scatter plot data every class period, you can pull a worksheet, hand it out, and immediately get students drawing, checking, and revising lines. That frees up your planning time for the parts of the lesson that actually need your voice: modeling reasoning out loud, circulating for misconceptions, and running discussion around why one line fits better than another.
The Standards Sequence Behind These Worksheets
Line of best fit worksheets are anchored in CCSS.Math.Content.8.SP.A.2, which asks students to informally fit a straight line to data with a linear association and judge the fit by how close the points sit to the line. That standard does not stand alone. It follows CCSS.Math.Content.8.SP.A.1, which requires students to construct and interpret scatter plots for bivariate measurement data and describe patterns like clustering, outliers, and positive or negative association.
That sequencing matters more than it looks on paper. A student who has not practiced reading association direction from a scatter plot will struggle to judge whether a drawn line is reasonable, because they have not built the pattern-recognition step the fitting skill depends on. If your line of best fit worksheets are the first scatter plot task a student sees all week, expect shaky results. Pair them with a quick scatter plot warm-up first.
Sequencing Worksheets Across a Lesson Arc
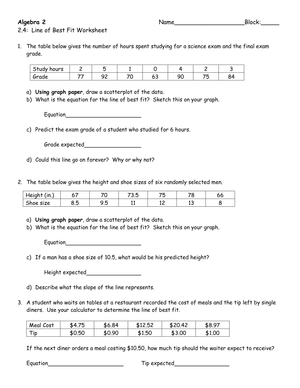
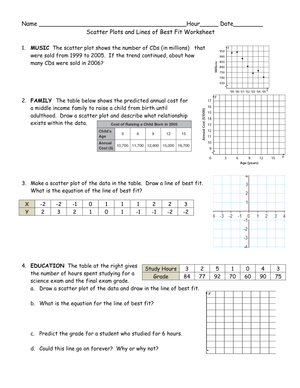
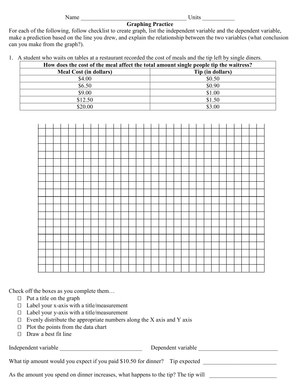
A clean way to use line of best fit worksheets is to think in three stages: guided practice, independent practice, and a formative checkpoint. In the guided stage, work through one or two scatter plots as a class, thinking aloud about where the line should go and why. In the independent stage, hand out a worksheet with several data sets so students draw lines on their own while you circulate.
The formative checkpoint stage is where line of best fit worksheets earn their place in your grade book. A short worksheet with two or three scatter plots, collected and scored quickly, tells you which students are ready to move into CCSS.Math.Content.8.SP.A.3, using a linear model equation to solve problems and interpret slope and intercept in context, and which students need another round of guided practice first.
Common Student Errors and How Worksheet Design Can Correct Them
Three errors show up again and again on line of best fit worksheets. First, students connect the first and last data points instead of balancing points above and below the line. Second, students draw a line that passes through the origin out of habit, even when the data clearly trends elsewhere. Third, students place a line that fits the majority of points but ignores a cluster that should pull the trend in a different direction.
You can design or select worksheets that target each of these directly. Include at least one scatter plot with an obvious outlier so students practice ignoring it when drawing the line. Include at least one data set that does not pass near the origin so students cannot default to that shortcut. Naming the error type when you hand back a worksheet, rather than just marking it wrong, helps students self-correct on the next attempt.
Classroom Implementation
Start each line of best fit worksheet session with a thirty-second reminder of the goal: balance the points, do not connect dots, and check the trend direction before drawing. Keep a visualizer or document camera handy so you can quickly project a student's line and ask the class whether it looks reasonable, which turns individual worksheet time into a shared discussion moment.
Batch your worksheets by difficulty across the week rather than handing out a random mix. Day one can use clean, obvious linear data. Day two can introduce a mild outlier. Day three can move into slope and intercept interpretation once drawing accuracy is solid. This progression mirrors the CCSS.Math.Content.8.SP.A.1 through 8.SP.A.3 sequence and keeps every worksheet purposeful rather than repetitive.
Bridging to Algebra 1 Linear Regression
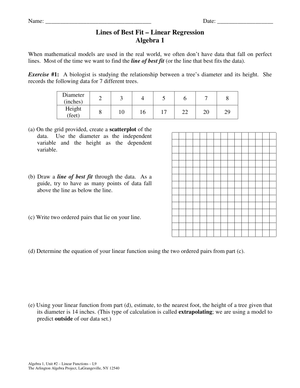
Line of best fit worksheets used in grade 8 are not the end of this skill. The same scatter plot reasoning resurfaces in Algebra 1 when students meet formal linear regression and learn that a calculator or software can compute a least-squares line rather than an eyeballed estimate. Students who practiced informal fitting carefully in grade 8 tend to have an easier time judging whether a computed regression line looks correct, because they already have an intuitive sense of what a reasonable fit looks like.
If you teach Algebra 1, consider using a grade 8-level line of best fit worksheet as a warm-up before introducing formal regression. It reactivates the visual estimation skill and gives you a quick read on which students need a scatter plot refresher before the new vocabulary and calculator steps are layered on top.
Frequently Asked Questions
1. What grade level typically covers line of best fit worksheets?
Line of best fit worksheets are most commonly used in grade 8 math classrooms, where the skill is anchored in CCSS.Math.Content.8.SP.A.2. The same worksheets are also useful in Algebra 1 as a review before introducing formal linear regression.
2. What prior skills should students have before starting line of best fit practice?
Students should already be comfortable constructing and interpreting scatter plots, including identifying clustering, outliers, and positive or negative association, which is the focus of CCSS.Math.Content.8.SP.A.1. Without that foundation, judging whether a drawn line fits the data becomes guesswork.
3. How can teachers assess whether a students line of best fit is reasonable?
Check whether the line has roughly balanced numbers of points above and below it across the full range of the data, rather than just near the middle. A reasonable line should also follow the overall trend direction and not be pulled off course by a single outlier.
4. How do line of best fit worksheets connect to slope and y-intercept standards?
Once students can draw a reasonable line, worksheets can extend into CCSS.Math.Content.8.SP.A.3, which asks students to write an equation for the line and interpret the slope and intercept in the context of the data, such as rate of change or a starting value.
5. How can these worksheets be used for intervention or reteaching?
For intervention, choose worksheets with fewer data points and a clearer linear trend so students can focus on the core skill of balancing the line without extra visual noise. Reviewing axis scales together before students begin also helps prevent common placement errors.