


1 / 2
0
Views
0
Downloads
0.0
0
Save
0 Likes
Analyze Scatter Plots and Lines of Best Fit
0 Views
0 Downloads
Paste this activity's link or code into your existing LMS (Google Classroom, Canvas, Teams, Schoology, Moodle, etc.).
Students can open and work on the activity right away, with no student login required.
You'll still be able to track student progress and results from your teacher account.
Information
Description
What It Is:
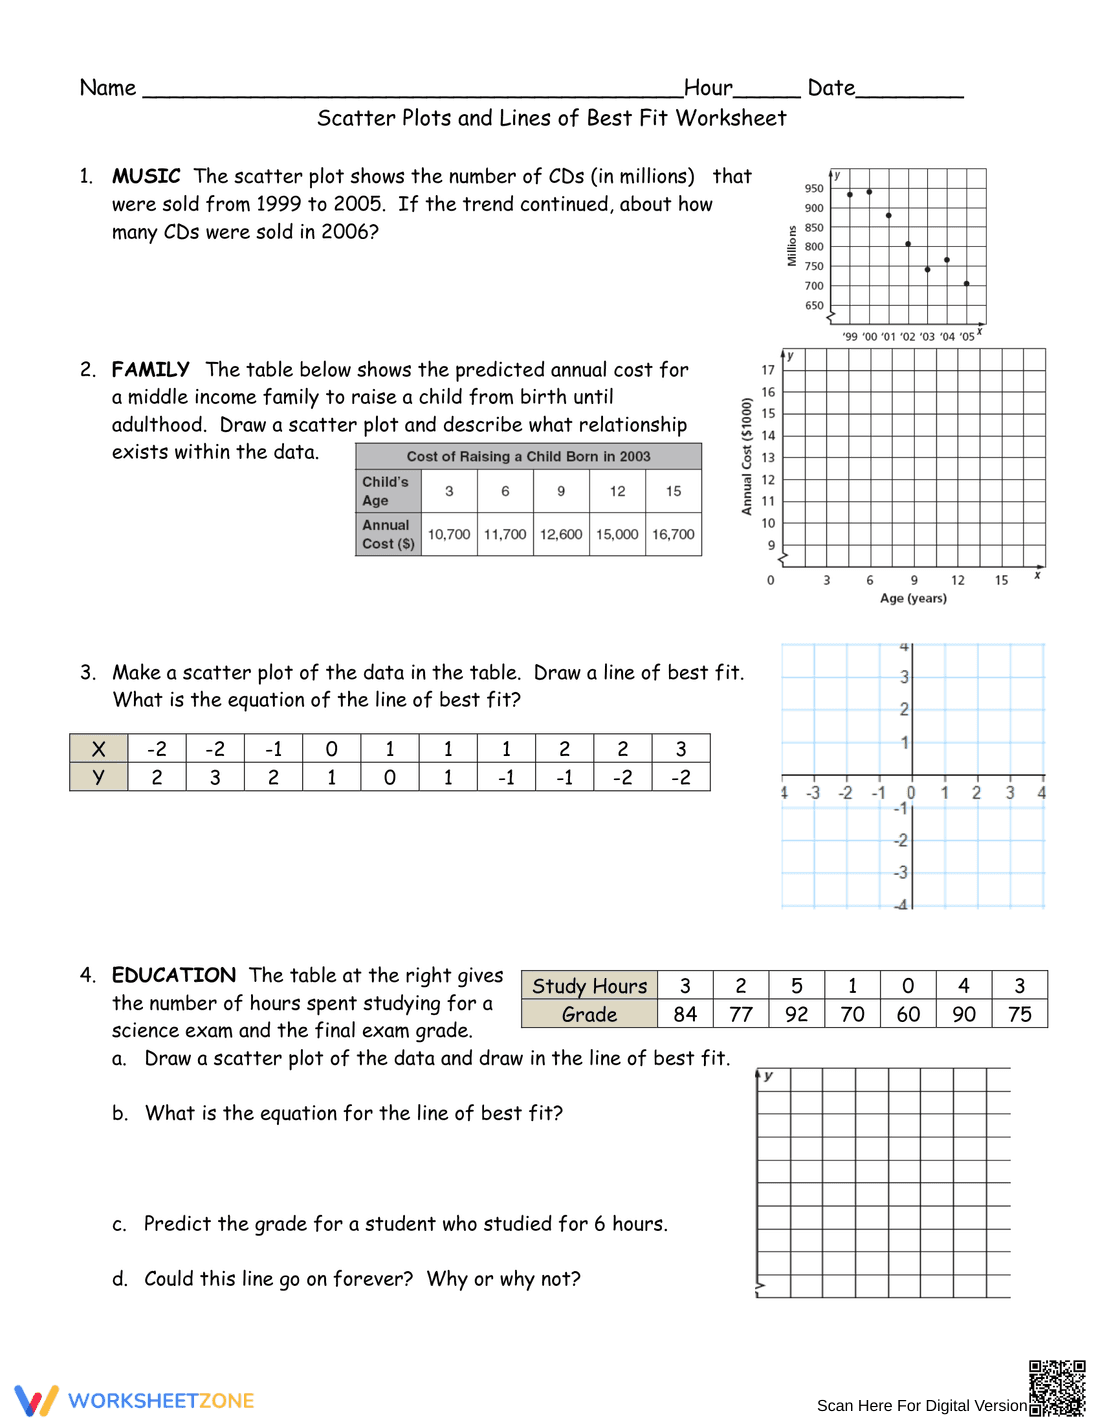
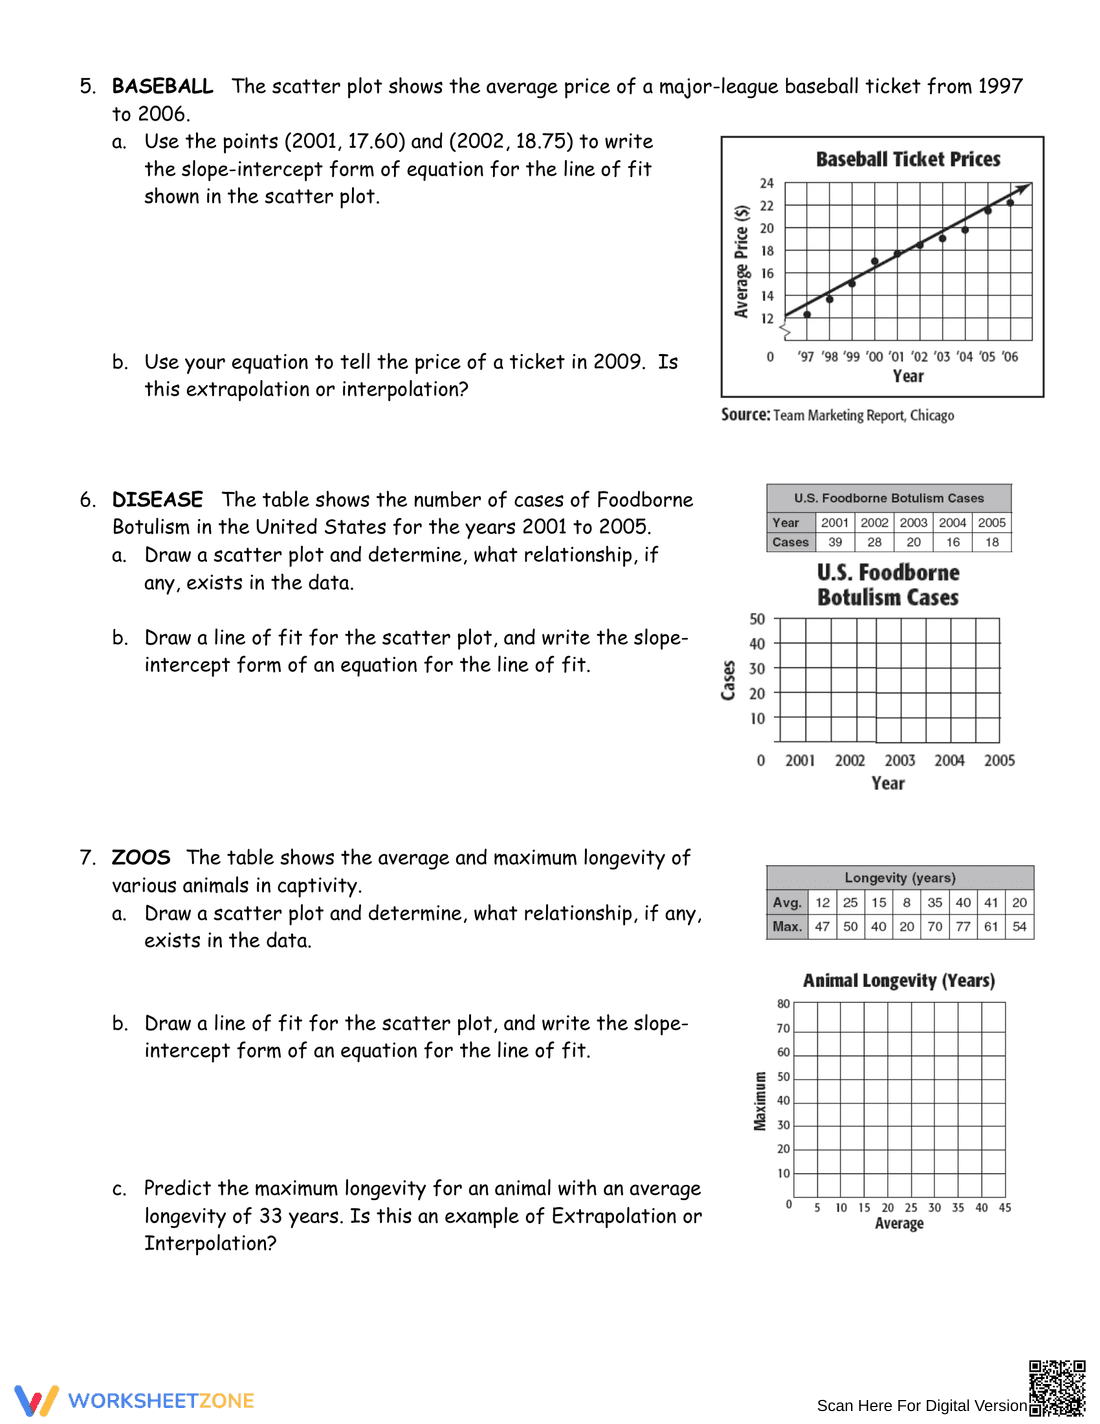
This is a worksheet focusing on scatter plots and lines of best fit. It includes four problems: one about CD sales data, one about the cost of raising a child, one based on a table of x and y values, and one related to study hours and exam grades. Students are required to create scatter plots, draw lines of best fit, and determine equations for those lines. The worksheet also includes questions that require interpretation of the data and predictions based on the trend.
Grade Level Suitability:
This worksheet is suitable for grades 8-10, likely Algebra 1 or introductory statistics. It requires understanding of coordinate planes, plotting points, identifying trends in data, and determining linear equations, all of which are typically taught in these grades.
Why Use It:
This worksheet provides practice in creating and interpreting scatter plots, drawing lines of best fit, and determining the equation of a line. It helps students develop skills in data analysis, making predictions based on trends, and understanding the relationship between variables. It also encourages critical thinking through questions that require students to justify their answers.
How to Use It:
Students should read each problem carefully and use the provided data to create a scatter plot on the given coordinate plane. After plotting the points, they should draw a line of best fit that represents the trend in the data. They should then determine the equation of the line and use it to answer the questions posed in each problem, such as making predictions.
Target Users:
The target users are students learning about scatter plots, lines of best fit, and linear equations in math or statistics courses. This worksheet is helpful for students who need extra practice with data analysis and interpretation. It can also be used as a review or assessment tool.