


1 / 2
0
Views
0
Downloads
Save
0 Likes
Line of Best Fit Worksheet for Data Analysis
0 Views
0 Downloads
Paste this activity's link or code into your existing LMS (Google Classroom, Canvas, Teams, Schoology, Moodle, etc.).
Students can open and work on the activity right away, with no student login required.
You'll still be able to track student progress and results from your teacher account.
Information
Description
What It Is:
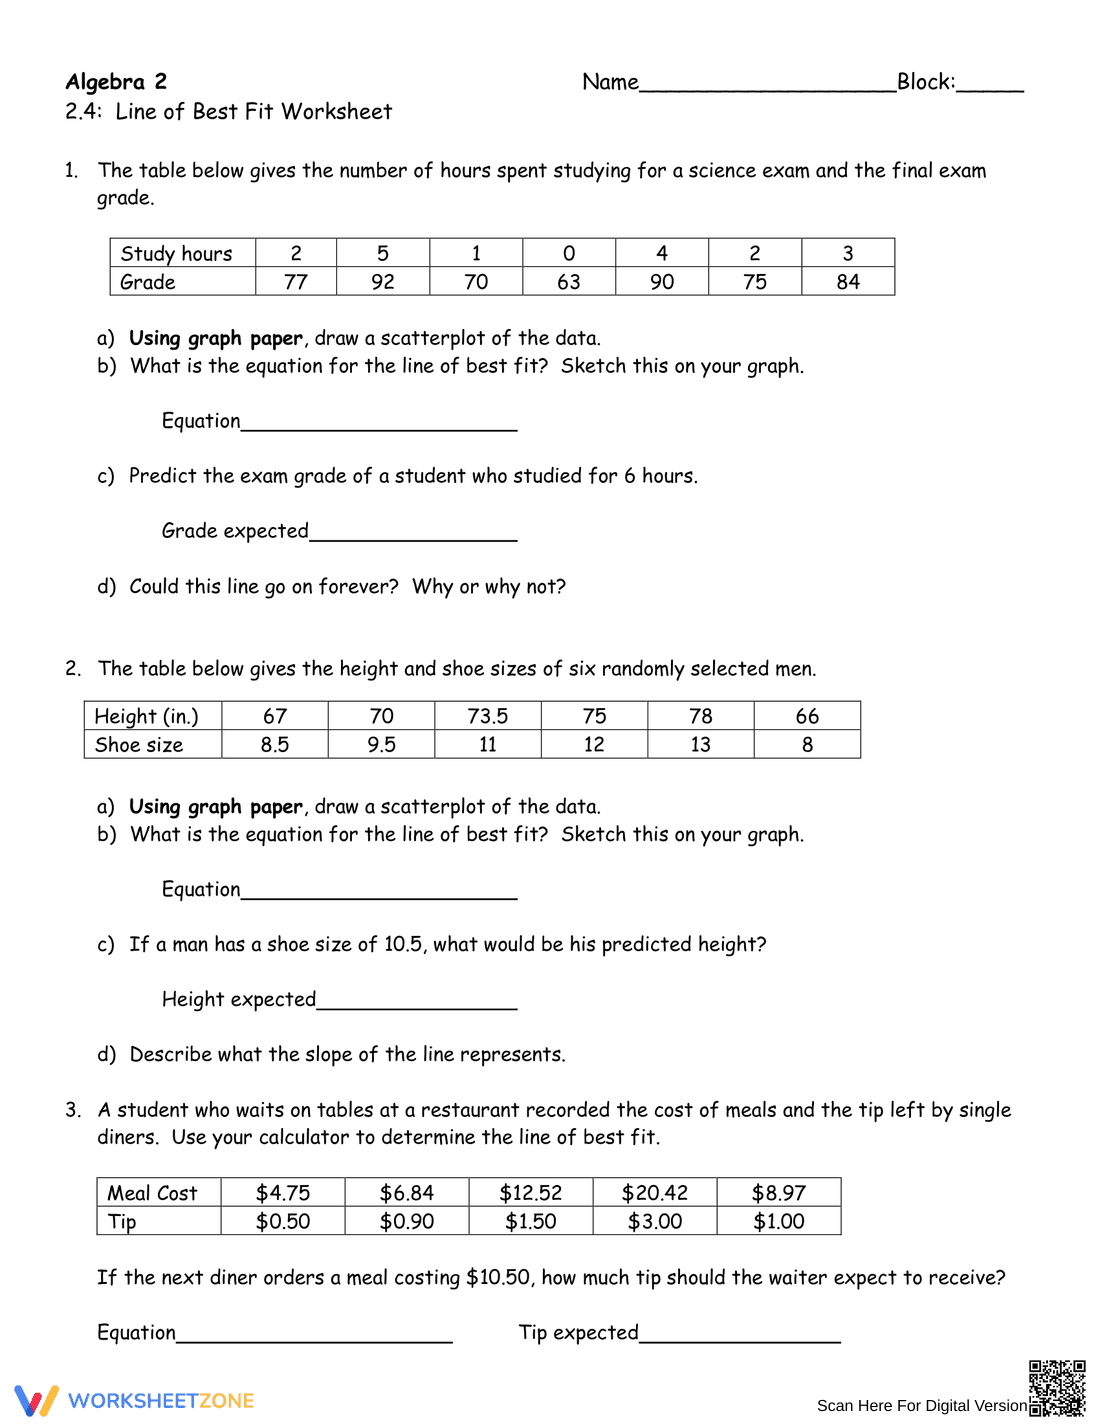
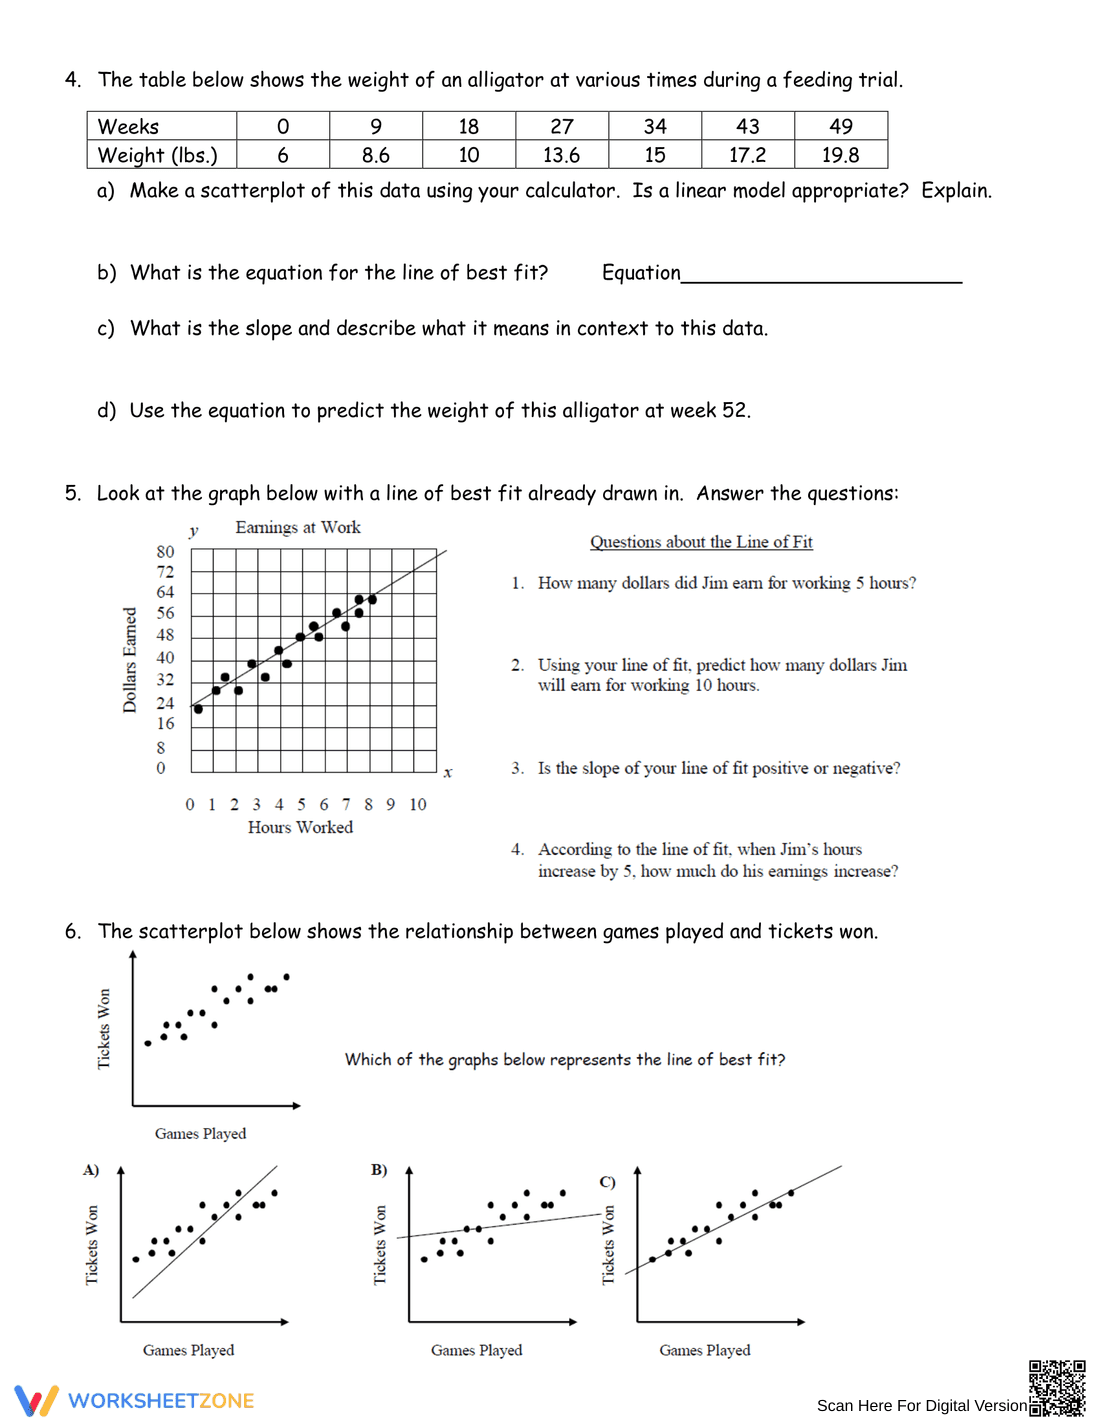
This is an Algebra 2 worksheet focusing on the line of best fit. It presents three problems involving creating scatterplots, determining the equation of the line of best fit, and making predictions based on the line. The first problem relates study hours to exam grades, the second relates height to shoe size, and the third relates meal cost to tip amount. The worksheet requires students to use graph paper and a calculator.
Grade Level Suitability:
This worksheet is suitable for Algebra 2 students (Grades 10-12). The concepts of scatterplots, line of best fit, and linear equations are typically covered in Algebra 2. The problems require students to analyze data and apply their knowledge of linear functions.
Why Use It:
This worksheet provides practice in applying linear regression concepts to real-world scenarios. It helps students develop skills in creating scatterplots, finding the equation of the line of best fit, interpreting the slope, and making predictions based on the data. It also reinforces the use of technology (calculator) to perform linear regression.
How to Use It:
Students should first read each problem carefully and identify the variables involved. They should then use graph paper to create a scatterplot of the data. Next, they should determine the equation of the line of best fit, either by hand or using a calculator. Finally, they should use the equation to make predictions and answer the questions posed in each problem.
Target Users:
The target users are Algebra 2 students who are learning about or need practice with linear regression and the line of best fit. It's also useful for teachers who need worksheets to supplement their lessons on this topic.