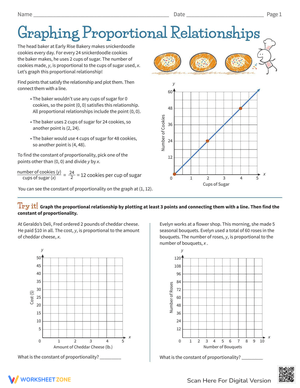
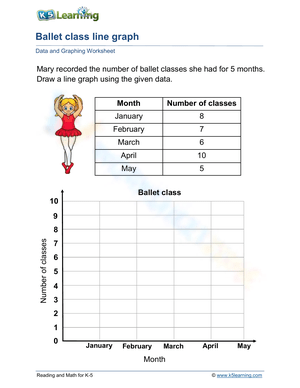
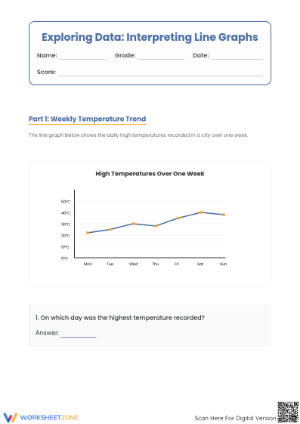
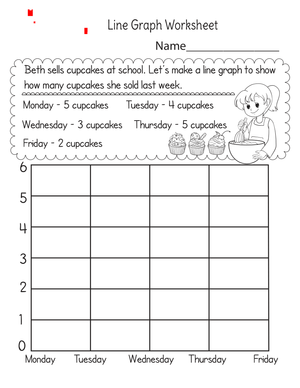
Line graph worksheets give students a structured way to move from simply reading numbers to reasoning about change over time. Unlike a single data table, a line graph asks a student to track a value across a sequence of points and describe what happened between them. For teachers planning a data-and-graphing unit, that shift from static reading to trend reasoning is exactly what later standards expect, and it does not happen automatically. Students need repeated, scaffolded practice with paired axes before they can construct and interpret a full line graph independently.
In practice, line graphs are most useful once students can plot more than ten data points and read two axes at the same time, which is why they typically appear in grade 4 and grade 5 worksheet sets rather than in early elementary data lessons. Introducing them earlier, before students are fluent with a single axis, usually produces graphs that are technically complete but conceptually shaky.
Prerequisite Skills Before Line Graph Practice
Before assigning a line graph worksheet, check that students can already do three things: read a labeled axis, locate a specific value using two coordinates, and compare two numbers to describe more or less. These are the same skills built through early picture and bar graph work, where students represent a data set with a small number of categories and answer simple comparison questions. If a student still struggles to find a value on one axis, a line graph with two moving axes will likely overwhelm them. A quick axis-reading warm-up, using a bar graph the class already knows, is a low-prep way to confirm readiness before moving on.
Sequencing Line Graph Worksheets by Grade Band
Line graph instruction works best as a sequence rather than a single lesson. Early grades build the data foundation, middle grades introduce scaled graphs, and upper elementary grades move into full line graph construction and summary work.
- Grades K-2: Represent and interpret data using picture and bar graphs with a small number of categories.
- Grade 3: Draw scaled picture and bar graphs and solve one- and two-step problems using the data shown.
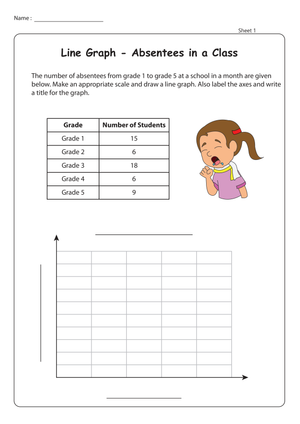
- Grades 4-5: Read and construct line graphs with more than ten data points, identify values at specific points, and describe change between two points.
- Grade 6: Display numerical data in dot plots, histograms, and box plots, and summarize and interpret data sets, extending the trend-reading habits started with line graphs.
Sequencing worksheets this way lets a teacher place each student on the right rung of the ladder, rather than assuming every fourth or fifth grader is ready for full line graph construction on day one.
Line Graphs Versus Bar Graphs in the Classroom
Bar graphs and line graphs answer different classroom questions, and worksheets should reflect that distinction rather than treating the two as interchangeable practice. A bar graph is the better tool when students are comparing separate categories, such as favorite fruits or pets in a class survey. A line graph is the better tool when students are tracking one variable across a continuous sequence, such as temperature readings over a week or a plants height measured every few days. When teachers use line graph worksheets specifically for continuous, sequential data, students start to internalize which graph type fits which situation, a judgment call that shows up again in later data and statistics standards.
Using Line Graph Worksheets for Formative Assessment
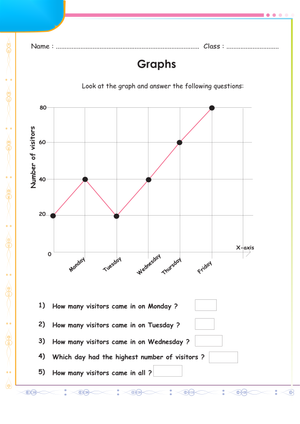
Line graphs offer a natural three-tier formative check that is easy to build into a short worksheet or exit ticket. The first tier asks a student to read a single data point, the second asks them to compare two points and state the difference, and the third asks them to describe the overall trend across the graph, such as a steady increase, a decrease, or a plateau. A teacher can scan a stack of these quickly and immediately see which students are stuck at point-reading and which are ready for full trend description. This tiered structure also makes small-group intervention planning faster, since students can be grouped by which tier they are missing rather than by a single overall score.
Frequently Asked Questions
1. What grade level are line graph worksheets appropriate for?
Line graph worksheets are most appropriate for grades 4 and 5, once students can read paired axes and plot more than ten data points. Earlier grades should focus on picture and bar graphs to build the prerequisite skills first.
2. Which Common Core standards do line graph worksheets align with?
Line graph practice builds on 2.MD.D.10 and 3.MD.3 for early data representation, and directly supports 6.SP.B.4 and 6.SP.B.5, which require students to display numerical data and summarize and interpret data sets.
3. How are line graphs different from bar graphs for classroom teaching purposes?
Bar graphs compare separate categories, while line graphs track one variable across a continuous sequence, such as measurements taken over days or weeks. Worksheets should match the graph type to the type of data being studied.
4. How can teachers use line graph worksheets for formative assessment?
Structure a quick check around three tiers: reading a single point, comparing two points, and describing the overall trend. This lets teachers spot exactly where a student is stuck without a full-length assessment.
5. What prerequisite skills should students have before line graph practice?
Students should be able to read a labeled axis, locate a value using two coordinates, and compare two numbers before attempting a line graph worksheet. A short bar graph warm-up is an easy way to confirm this readiness.