


0
Views
0
Downloads
0.0
0
Save
0 Likes
Line Graph - Absentees in a class
0 Views
0 Downloads
Paste this activity's link or code into your existing LMS (Google Classroom, Canvas, Teams, Schoology, Moodle, etc.).
Students can open and work on the activity right away, with no student login required.
You'll still be able to track student progress and results from your teacher account.
Information
Description
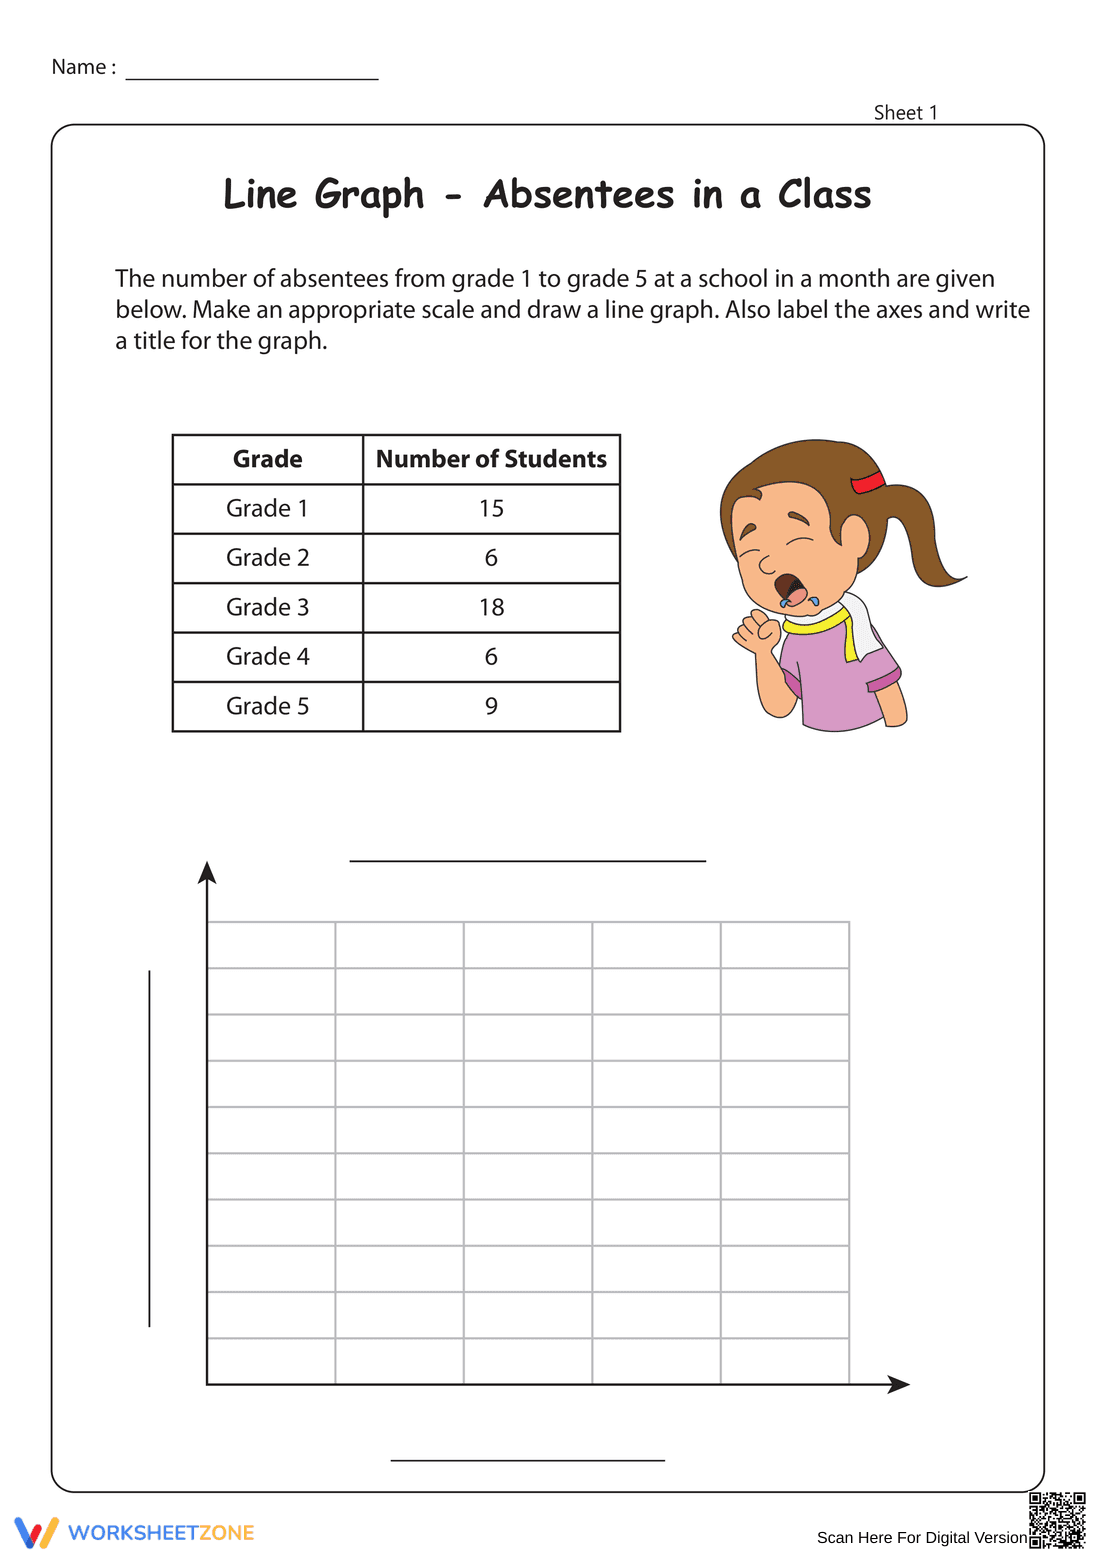
What It Is:
A data interpretation worksheet where students use given information to create a line graph showing the number of absentees from Grade 1 to Grade 5 in a month.
Why Use It:
This activity helps students understand how to represent data visually, read tables, and plot points accurately on a line graph. It also enhances analytical and mathematical reasoning skills.
How to Use It:
• Review the table showing absentees for Grades 1–5.
• Choose an appropriate scale and draw a line graph using the provided grid.
• Label the x-axis and y-axis, then add a clear title for your graph.
Grade Suitability:
Best for Grades 3–5.
• Grade 3: Introduces basic line graph plotting.
• Grades 4–5: Strengthens data interpretation and scaling accuracy.
Target Users:
Elementary school teachers, students, and homeschool educators seeking to practice graphing and data handling skills.