These bar graph worksheets give teachers a ready-to-print set of practice pages covering every skill in the elementary data and graphing progression — reading completed graphs, interpreting scaled axes, and drawing bars from raw data tables. The collection spans grades 1 through 5, so one download covers a full range of readiness levels without hunting across multiple sites.
Skills Covered Across the Set
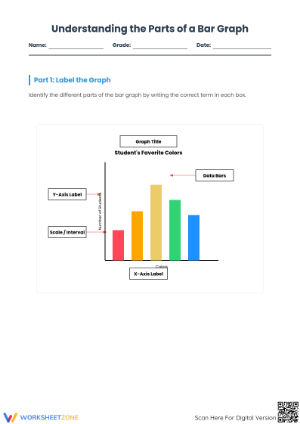
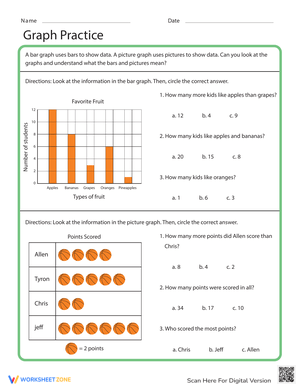
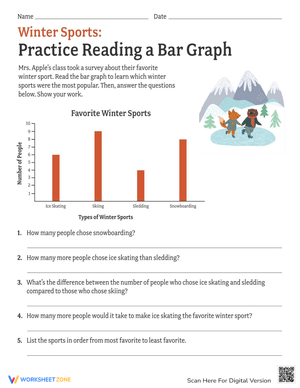
The foundational pages ask students to read a finished graph and answer direct questions: which category has the most, which has the least, how many more does one bar show than another. That last question — the difference between two bars — is where first attempts typically fall apart. Students read each bar correctly in isolation but then subtract the wrong pair, often pulling numbers from adjacent categories rather than the two named in the question. Building in repeated practice with difference questions early prevents that habit from hardening.
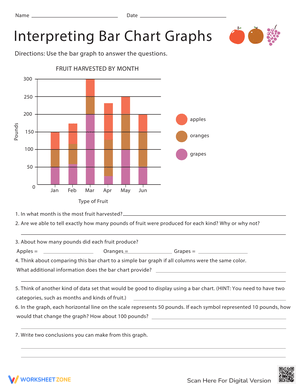
At the middle grades, the pages shift to scaled axes where each grid line represents 2, 5, or 10 units. Students who have only worked with a scale of 1 treat every line as worth 1 and misread bars by a factor of the scale — a bar sitting at the third gridline on a scale-of-5 graph gets recorded as 3 instead of 15. The worksheets in this range include explicit scale labels and enough guided problems that students internalize the skip-counting check before moving to independent work.
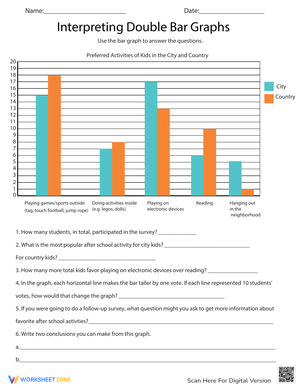
The upper-grade pages introduce double-bar graphs comparing two data sets on a single graph — a format that appears on state assessments in grades 4 and 5 and demands that students track both a category label and a group label simultaneously before they can answer anything.
What's on Each Page
Pages fall into three formats, and a balanced set needs all three:
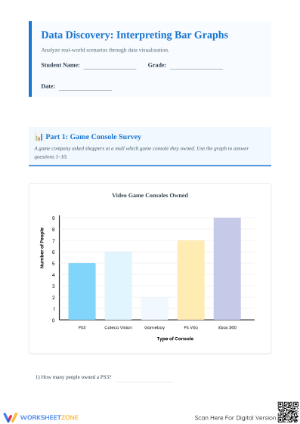
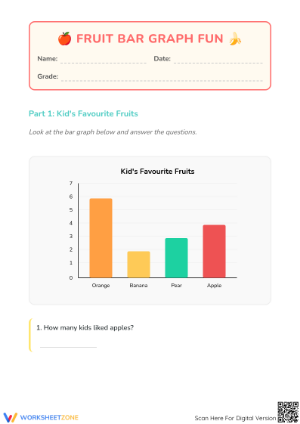
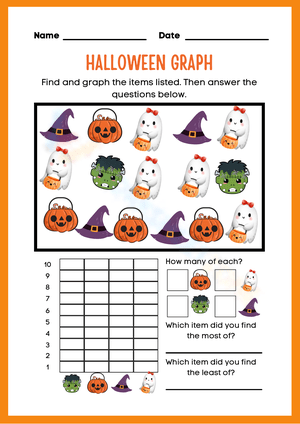
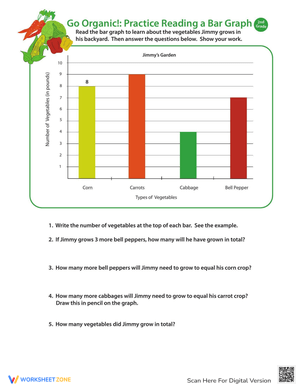
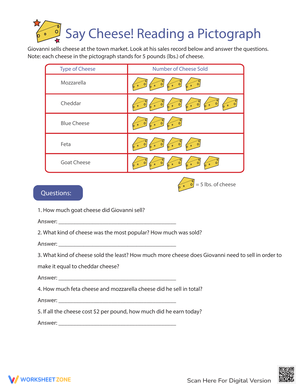
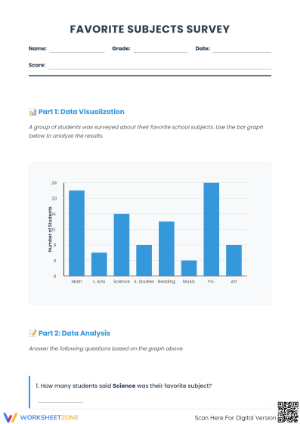
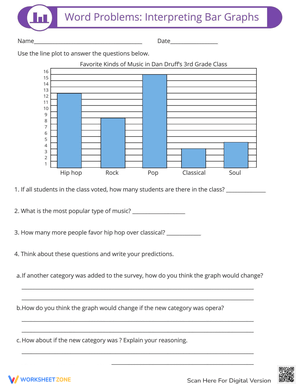
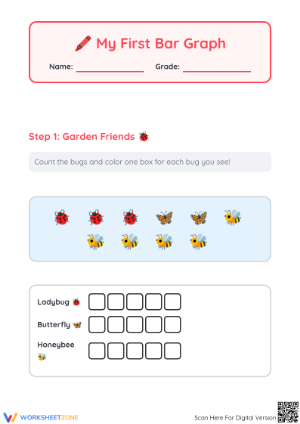
- Read-and-interpret pages — a completed bar graph with 4–6 questions beneath it, ranging from direct lookup (how many students chose soccer?) to multi-step reasoning (how many more students chose soccer than baseball combined with basketball?).
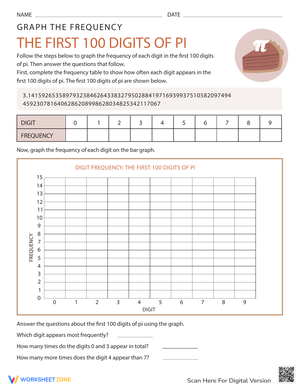
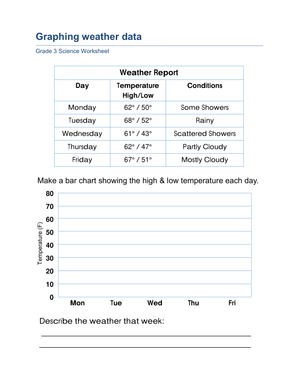
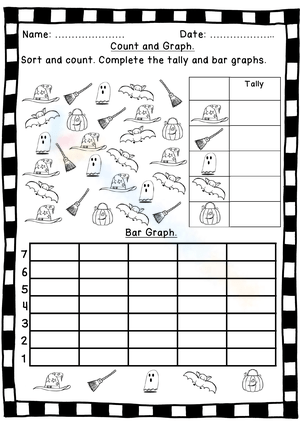
- Graph-construction pages — a data table and a blank or partially labeled grid. Students determine the scale, draw each bar to the correct height, and label the axes. The construction step is where understanding of scale becomes visible; a student who seemed fine on the reading pages will reveal a gap the moment they have to choose an appropriate axis scale.
- Mixed-task pages — one graph to read followed by a second blank grid to complete from a separate data set. These work well as end-of-unit assessments because they capture both receptive and productive skills on a single page.
Where These Fit in the School Day
A single read-and-interpret page makes a clean warm-up for the 5–8 minutes between morning meeting and the math block. Three or four questions, no materials beyond a pencil — students settle in, activate number sense, and you get a quick read on who needs support before whole-group instruction starts.
In a math center rotation, separate the reading pages from the construction pages so each station targets one skill. Students at the reading station work independently; students at the construction station often benefit from a partner to cross-check scale choices. Running both in the same block means every student practices interpreting and building graphs within a single session, which matters because the two skills reinforce each other in ways that doing only one does not.
One classroom routine worth building: have students gather real data — shoe sizes, number of siblings, how many books read this month — and then transfer that tally to a blank bar graph template. The graph stops being an abstract exercise and becomes a record of something students actually know. That shift in purpose noticeably raises engagement, especially among students who produce correct answers mechanically but struggle to explain what a graph means.
Error Patterns Worth Watching
Beyond the scaled-axis misread described above, two other errors appear consistently in student work. First, students drawing bar graphs on construction pages will sometimes make bars that reach close to a gridline but land slightly between lines — then record the value as the nearer number rather than retracing to the axis. Reminding students to draw bars to a line, not near one, and to always confirm the value by reading the axis rather than eyeballing the bar height, catches this before it becomes a pattern.
Second, on horizontal bar graphs, a meaningful number of students flip their axis reading — they look at the vertical axis for a value that should be read on the horizontal axis. This happens because most early exposure is to vertical bar graphs, and the reorientation is not automatic. Explicitly contrasting a vertical and horizontal version of the same data set — asking students what changed and what stayed the same — resolves the confusion faster than additional practice on horizontal graphs alone.
Standards Aligned
The Common Core clusters these skills under the Measurement and Data domain. 2.MD.D.10 introduces bar graphs at grade 2, asking students to draw and interpret graphs with up to four categories. 3.MD.B.3 scales the expectation significantly — students solve one- and two-step problems using scaled bar graphs, which is the standard that motivates the scale-of-5 and scale-of-10 pages in this set. Teachers often use the grade 2 pages as a review or pre-assessment entry point early in third grade before introducing the scaled work, particularly with students who didn't get solid exposure in second grade.
Adjusting for the Range of Learners in the Room
The clearest lever for differentiation is scale complexity. Students who are still building number sense work on pages with a scale of 1; on-grade students move to scales of 2, 5, and 10; students ready for extension work on double-bar graph pages or construction pages that require them to choose their own scale based on the range of values in a data set. That last task — selecting an appropriate scale — is a meaningful stretch because it requires reasoning about the data before touching the graph.
For students who freeze when presented with a blank grid, partially completed graphs (axes labeled, first bar drawn) lower the entry barrier without removing the skill demand. The student still has to read the data table and draw the remaining bars accurately; they just aren't also managing the cognitive load of setting up the grid from scratch.
Frequently Asked Questions
1. Can these pages serve as a pre-assessment before a data unit?
A mixed-task page works well as a pre-assessment. Reading performance tells you whether students can already interpret a graph; construction performance shows whether they understand how data maps onto a visual representation. The two results don't always match — a student may read graphs accurately but have no idea how to build one — and knowing that distinction before instruction starts shapes how you group students for the unit.
2. How do I handle students who skip directly to the questions without reading the graph carefully?
Build in a brief annotation step before the questions: students underline the axis labels, circle the scale marker, and write the scale value in the margin. Thirty seconds of forced orientation slows the impulse to guess and gives students a reliable starting routine they can apply independently over time.
3. At what point do bar graphs connect to line graphs and other formats?
Bar graphs handle categorical data well; line graphs handle data that changes over time. Once students are fluent with bar graphs, showing them the same temperature data displayed as both a bar graph and a line graph — and discussing which communicates the trend more clearly — builds exactly the kind of critical thinking about data display that carries into middle school statistics work.