What Phase Diagram Worksheets Build in a Matter Unit
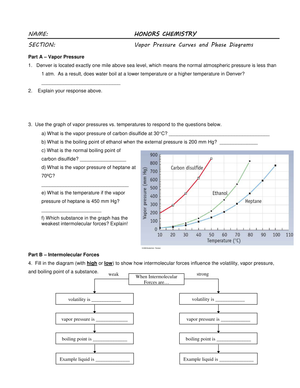
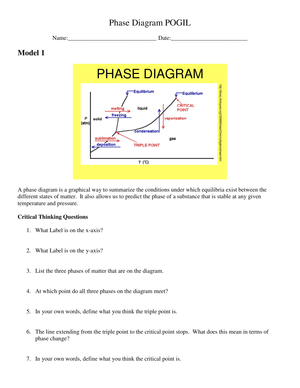
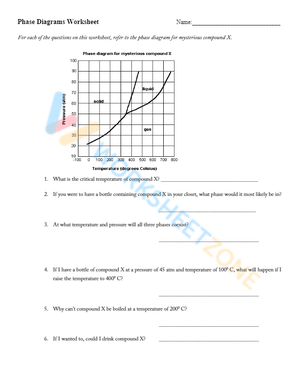
A phase diagram plots temperature on the x-axis against pressure on the y-axis and shades in which state a substance holds at each combination. That single graph packs a lot of reasoning, and students rarely read it well on the first try. Phase diagram worksheets give US science teachers a structured way to move students from solid, liquid, gas vocabulary to actually interpreting where those phases live on a pressure-temperature map. For grades 6-12, that skill sits at the center of the matter unit.
The best worksheets don't just ask for definitions. They hand students a labeled or partly labeled diagram and require them to point to the solid region, trace a phase boundary, and predict what happens when you heat a sample at constant pressure. That's the difference between recognizing a graph and using one.
Search demand for these sheets is steady because the topic shows up in three different courses: middle school physical science, high school chemistry, and introductory physics. One well-built set of phase diagram worksheets can serve all three if you scale the difficulty. That reach is part of why teachers keep a labeled diagram, a blank diagram, and a mixed practice set on hand for the whole matter unit.
Reading the Diagram: Regions, Boundaries, and Key Points
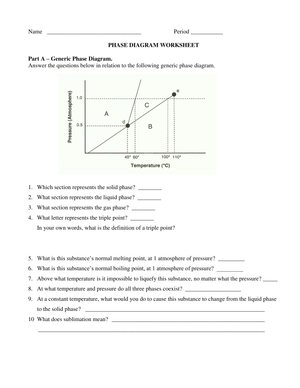
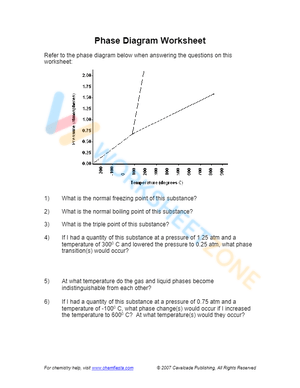
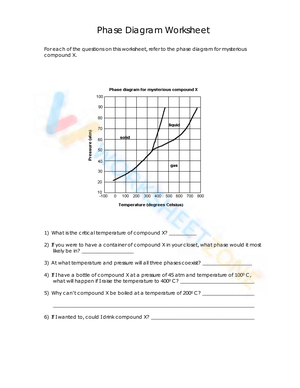
Every phase diagram worksheet should push students to name four features accurately: the three phase regions, the boundary lines between them, the triple point, and the critical point. The triple point is the one temperature-pressure combination where solid, liquid, and gas coexist in equilibrium. The critical point marks the highest temperature and pressure at which distinct liquid and gas phases still exist; past it, the substance becomes a supercritical fluid.
Give students tasks that isolate each skill. Labeling exercises check vocabulary. Follow-the-arrow tasks, where a student traces a horizontal or vertical path across a boundary, check whether they can connect a physical change to a line crossing. Identification questions ask which phase sits at a specific coordinate. Sequencing these from simple to complex keeps the cognitive load manageable.
Water and Dry Ice: The Comparison Worth Teaching
The clearest reason to use two phase diagrams side by side is the dry ice question. Students who assume every solid melts get stuck when carbon dioxide skips the liquid phase entirely.
According to OpenStax Chemistry, water's triple point sits at 0.01°C and 611.657 pascals, the single pressure-temperature combination where solid, liquid, and gas coexist in equilibrium. Below that pressure liquid water cannot exist at any temperature, which is exactly the reasoning a phase diagram worksheet asks students to trace.
Here's the detail that makes the comparison click: CO2's triple point sits at -56.6°C and 5.11 atm, which is above normal atmospheric pressure of 1 atm. Because the atmosphere never reaches the pressure the liquid region requires, a chunk of dry ice at room conditions crosses straight from solid to gas. Water's triple point, by contrast, sits far below 1 atm, so ice at everyday pressure passes through liquid first. Put the two diagrams next to each other and students can watch the misconception dissolve.
Connecting Worksheets to NGSS MS-PS1-4
For middle school, MS-PS1-4 asks students to develop a model that predicts and describes changes in particle motion, temperature, and state of a pure substance as thermal energy is added or removed. A phase diagram is one such model. When a worksheet asks a student to explain why crossing the melting boundary requires added energy, they're reasoning about particle motion, not just reading a graph.
Tie every diagram-reading task back to the particle model. If a student traces a path from the solid region into the liquid region, follow up with what are the particles doing here? That link between the 2D graph and the invisible particle behavior is what MS-PS1-4 is really after.
Classroom Implementation
Sequencing matters. Most teachers get better results when phase diagram practice follows heating and cooling curve work. A heating curve is a 1D story: temperature versus time at constant pressure. A phase diagram is the 2D version, adding pressure as a second variable. Students who can already read a heating curve have a mental hook for the harder graph.
Use phase diagram worksheets as a formative check the day before a lab or quiz. A ten-minute labeling and identification set tells you fast whether students can find the triple point and name each region. For small-group intervention, pull the students who understand states of matter but stumble on graph-reading; their gap is usually axes and coordinates, not the science.
- Warm-up: label a blank diagram from memory.
- Guided practice: trace three constant-pressure heating paths.
- Exit ticket: explain why dry ice sublimes using the diagram.
Keep the routine short and repeatable. A single diagram revisited across several days beats a new sheet each time, because students build fluency with one graph before they meet the next variation.
Frequently Asked Questions
1. What grade level are phase diagram worksheets appropriate for?
They fit grades 6-12. Middle school students use qualitative versions focused on identifying phases and key points, while high school chemistry students work with quantitative values and pair the diagrams with heating and cooling curves.
2. What is the difference between a phase diagram and a heating or cooling curve worksheet?
A heating or cooling curve plots temperature against time at constant pressure, telling a 1D story of one heating run. A phase diagram plots temperature against pressure, showing every possible state at once. Teach the curve first, then the diagram.
3. How do phase diagram worksheets support NGSS MS-PS1-4?
MS-PS1-4 asks students to model changes in particle motion, temperature, and state as thermal energy moves in or out. A phase diagram is that model in graph form, so tracing a path across a boundary becomes a claim about what particles are doing.
4. Why does CO2 sublime while water melts?
Carbon dioxide's triple point sits at 5.11 atm, above normal atmospheric pressure, so its liquid region is never reached at room conditions and solid goes straight to gas. Water's triple point sits well below 1 atm, so ice passes through liquid first.
5. What skills should students demonstrate before moving to lab work?
Students should label all three phase regions, locate the triple and critical points, trace a constant-pressure heating path across a boundary, and explain one phase change in terms of particle motion. That combination signals they're ready to apply the diagram in a lab.












 Interactive Worksheet Maker
 Quiz Maker
 Word Search Maker
 Crossword Puzzle Maker
 Word Scramble Generator
 Sentence Scramble Generator
 Handwriting Worksheet Generator
 Name Tracing Generator
 Fill In The Blank Generator