If your students can solve PE = mgh but freeze when you ask what the number means, a potential energy diagram worksheet is the missing step. These pages turn energy conservation into something students can see and label before they ever touch a formula. Here's how to choose, sequence, and grade them in a US physical science classroom.
What a Potential Energy Diagram Worksheet Actually Teaches
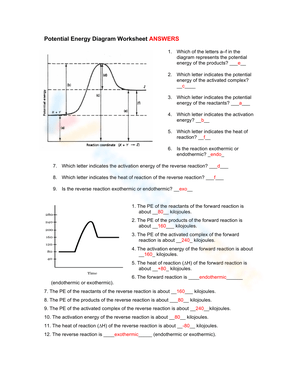
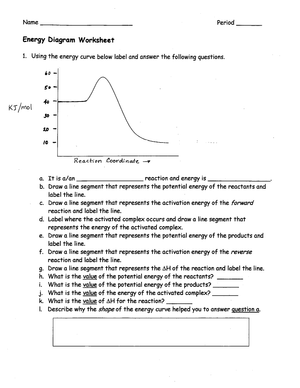
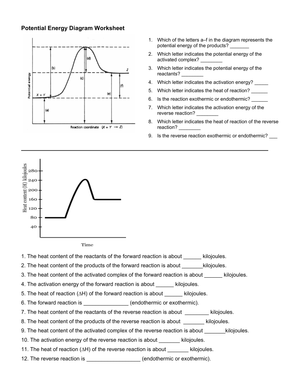
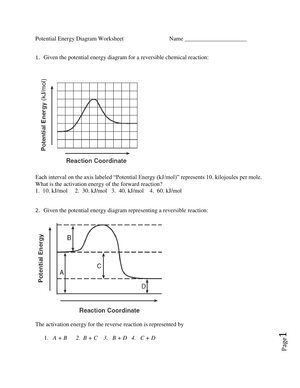
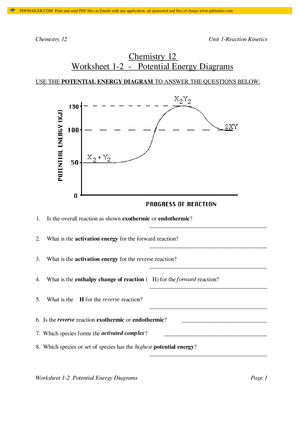
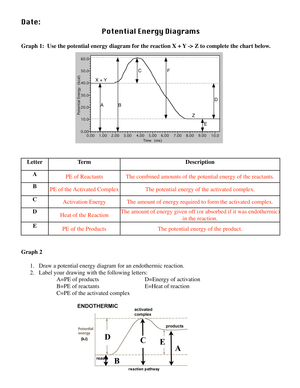
A potential energy diagram plots stored energy against position, and that single move—turning motion into a picture—is what makes these worksheets so useful. When students trace a marble down a roller coaster hill or watch a pendulum swing, they see potential energy peak at the highest point, where velocity drops to zero, and kinetic energy peak at the lowest point, where potential energy sits near zero. A well-built page asks students to label those points, predict where speed is greatest, and explain why the two forms of energy trade off without disappearing. That last idea, conservation, is the concept most students miss when they jump straight to equations. Before anyone calculates PE = mgh, they need a mental model of energy moving through a system, and a labeled diagram gives them one they can point to. These pages work because they are concrete: a track, a set of marked positions, and a question that forces a claim about where energy is stored and where it is in motion.
Roller Coaster and Pendulum Models as an Entry Point
Roller coasters and pendulums earn their place on these worksheets because they are low-stakes and familiar. Students in grades 6 through 10 have ridden a coaster or pushed a swing, so the physics feels approachable before the vocabulary does. A typical task shows a coaster track with points A through E labeled at different heights and asks students to rank potential energy, rank kinetic energy, and mark where the car moves fastest. A pendulum version does the same with the bob at the top of its arc versus the bottom. The Physics Classroom's interactive Roller Coaster Model pairs naturally with these pages: students set a track, run the simulation, and watch real-time energy bar charts shift as the car climbs and drops. Running the simulation first, then completing a paper diagram, gives students a reference they trust. The pairing turns an abstract graph into something they have already watched happen, which is exactly the bridge struggling students need.
Aligning Practice to NGSS Energy Standards
Potential energy diagram tasks map cleanly onto two Next Generation Science Standards performance expectations, so the worksheets do double duty as instruction and evidence. In middle school, MS-PS3-5 asks students to construct and use arguments supported by evidence about how an object's motion changes, and diagram labeling gives them that evidence in visual form. In high school, HS-PS3-2 raises the bar toward full model-building.
According to the Next Generation Science Standards, HS-PS3-2 requires students to develop and use models to illustrate that energy at the macroscopic scale can be accounted for as a combination of the motion of particles and the energy stored in fields—and a labeled potential energy diagram is exactly that kind of model.
Reading Diagrams Versus Energy Bar Charts
Diagrams and energy bar charts answer different questions, and students benefit from seeing both. A potential energy diagram is continuous: it shows how stored energy changes across every position on a track or arc, so students can read a smooth curve and locate maxima and minima. An energy bar chart is a snapshot: it freezes one moment and shows the split between kinetic, potential, and any energy lost to friction. Used together, they catch the single most common misconception in this unit—the belief that energy is used up or lost as the coaster slows. When a bar chart shows total energy staying constant while the potential and kinetic bars trade height, students confront conservation directly. Add a friction bar and the total still holds, which quietly corrects the idea that energy vanishes. Worksheets that ask students to sketch a bar chart at three points along a diagram they just labeled force them to reconcile the two representations, and that reconciliation is where real understanding shows up.
Classroom Implementation
Start with a short demonstration—a pendulum on a ringstand or a marble on a curved track—and ask students to predict where the object moves fastest before you hand out any paper. Then move through the worksheet in three passes.
- First pass: students label PE and KE at each marked point using only high, low, or zero.
- Second pass: they rank the points and defend one ranking in a sentence.
- Third pass: they sketch an energy bar chart at two positions and check that the totals match.
For small-group intervention, shrink the diagram to three points and provide a word bank. For enrichment, ask fast finishers to add a friction segment and explain how the diagram changes. Circulating during the second pass tells you quickly who still thinks the highest point has the most kinetic energy—a fast, informal formative check you can act on the same day. Collecting the third-pass bar charts gives you a gradeable artifact tied directly to the conservation idea, without waiting for a quantitative quiz.
Frequently Asked Questions
1. What grade level are potential energy diagram worksheets appropriate for?
They fit grades 6 through 10. Middle school students work with labeling and ranking tasks tied to MS-PS3-5, while high school students take on model-building tasks aligned to HS-PS3-2.
2. How do potential energy diagrams differ from energy bar charts?
A diagram shows stored energy continuously across position, while a bar chart freezes one moment and splits energy into kinetic, potential, and lost-to-friction portions. Using both catches the energy-is-lost misconception.
3. What NGSS standards do these activities support?
MS-PS3-5 for middle school and HS-PS3-2 for high school. Both center on modeling energy as a combination of motion and stored energy.
4. Can I use these worksheets for formative assessment?
Yes. Circulate as students rank points and defend their choices, then collect their bar charts as a gradeable check on conservation understanding.
5. What sequence works best before quantitative problems?
Introduce potential energy conceptually, label diagrams to build the conservation model, then move to PE = mgh and spring calculations.












 Interactive Worksheet Maker
 Quiz Maker
 Word Search Maker
 Crossword Puzzle Maker
 Word Scramble Generator
 Sentence Scramble Generator
 Handwriting Worksheet Generator
 Name Tracing Generator
 Fill In The Blank Generator