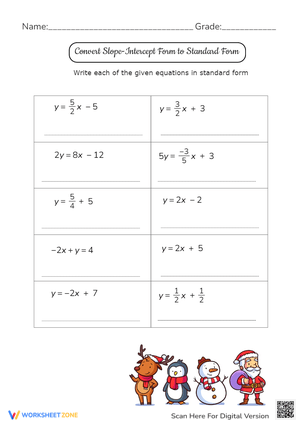
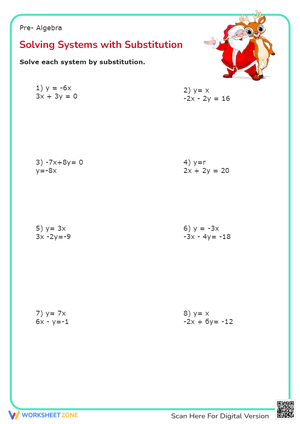
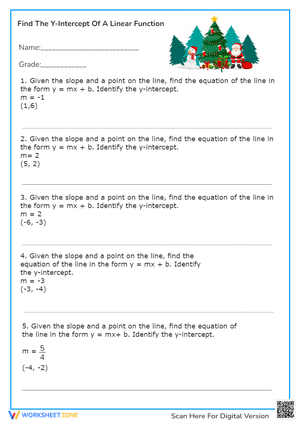
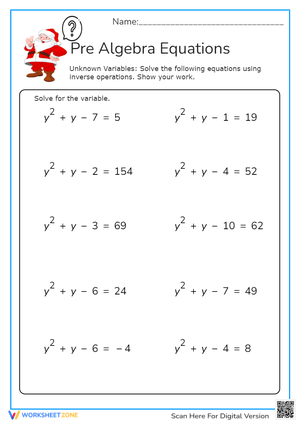
These 8th grade writing linear equations pdf worksheets give middle school math teachers printable practice on the skill that anchors the whole linear relationships unit: turning a graph, a table, two points, or a word problem into an equation that actually fits. By eighth grade, students are expected to move past reading a line off a graph and start producing the rule themselves, and these worksheets push them to recognize the same linear structure no matter how it shows up.
The Specific Skills Targeted
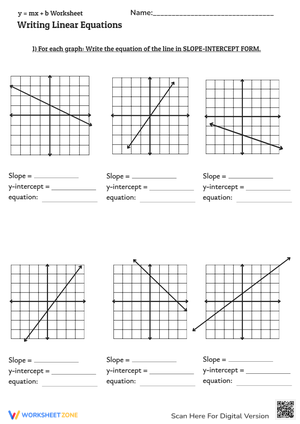
The work here centers on slope-intercept form, but the real goal is flexibility — students should pull slope and starting value out of any representation and write y = mx + b without being told which method to use. A student who can write y = 3x + 5 from a graph but stalls when handed a table of the same relationship hasn't really understood slope and initial value yet; they've memorized one procedure. The mixed item types in the set are meant to surface exactly that gap.
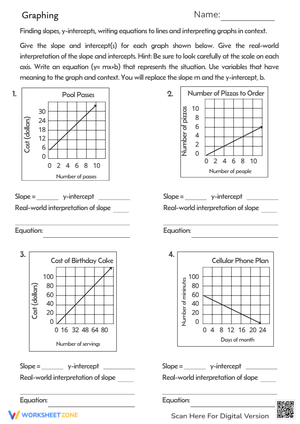
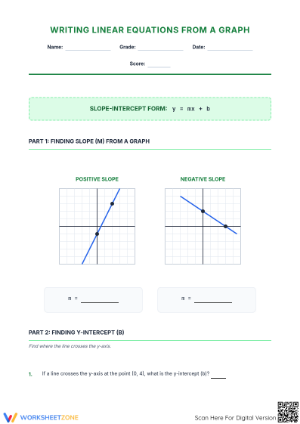
- Graph to equation: read slope from a slope triangle, find the y-intercept, write the rule.
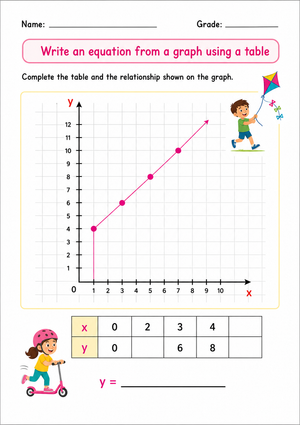
- Table to equation: spot the constant rate of change between rows and confirm with an ordered pair.
- Two points to equation: compute slope, substitute a point, solve for the intercept.
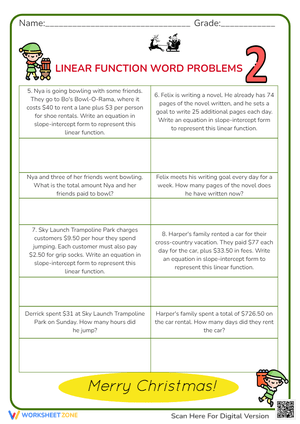
- Words to equation: model hourly pay, taxi fares with a flat fee, savings goals, or cooling temperatures.
- Error analysis: read a wrong equation and explain where the reasoning broke.
That last category does more diagnostic work than people expect. When a student has to write out why someone else got y = 5x + 3 instead of y = 3x + 5, you find out fast whether they can tell slope from intercept under pressure.
Where These Fit in a Linear Relationships Unit
A short graph-to-equation set runs well as a warm-up the day after direct instruction on slope-intercept form. A mixed worksheet with tables, points, and a couple of contexts works better as independent practice once students have seen all the representations at least once. The set also splits cleanly for an exit ticket — one graph item and one word problem tell you most of what you need to know before the next day's lesson.
The sequence that holds up best moves from graphs to tables to real-world contexts. Graphs make slope and intercept visible, so students start where the math is concrete. Tables ask them to generalize the repeated change they can see. Word problems force them to decide what the numbers actually mean — which one is the rate, which one is the starting amount. By the time they're writing equations from two bare points, they've built enough sense of the parts that the abstraction doesn't feel like a new topic.
One move worth stealing: sort the items by the clue students should notice first. Group a few where the intercept is obvious, a few where the rate jumps out, and a few where the starting value is buried in a sentence. The 8th grade writing linear equations pdf worksheets become a thinking routine when students learn to ask "what's the most visible piece of information here?" before they touch a pencil. That habit transfers across graphs, tables, and contexts far better than drilling one format.
Frequent Student Errors Worth Watching For
Most of the trouble in this unit comes from one confusion: students blur the steps for finding slope with the steps for finding the intercept. They'll calculate slope correctly and then just guess the constant. Or they'll grab the x-value from an ordered pair and call it the y-intercept because it came first. Watching for these in real time saves a lot of reteaching later.
- Counting rise over run backward, especially when the change is negative.
- Swapping x- and y-columns when reading a table.
- Assuming every line passes through the origin, so the intercept "must" be zero.
- Writing the slope in the intercept slot or vice versa.
- Dropping a real-world flat fee instead of using it as the constant term.
- Flipping a sign when moving from two points to the equation.
The worksheets are most useful when they require students to label the slope, mark the intercept, and name which representation they used. That visible record turns a wrong answer into something you can actually diagnose. An answer key that shows the pathway, not just the final equation, is worth far more than one that lists results.
Adjusting the Set for a Range of Learners
Differentiation here doesn't mean writing separate assignments. For students who need more support, hand out the versions with partially completed steps, clearly labeled axes, and tables that already highlight the constant difference between rows. Keep the numbers friendly — whole-number slopes, intercepts you can read straight off the grid. For students ready to stretch, bring in fractional and negative rates, equivalent forms of the same equation, and comparison tasks that ask which of two linear relationships is growing faster.
Assigning by representation is another low-prep option. Some students need a run of graph-to-equation items before tables and word problems make sense; others can start on mixed practice that forces a strategy choice. Either way the destination is the same — understanding what the equation means, not racing to a number.
Standard Alignment
This practice maps directly to the Grade 8 Expressions and Equations and Functions standards, particularly 8.EE.B.6 (using similar triangles to explain why slope is constant and deriving y = mx + b) and 8.F.B.4, which asks students to construct a function to model a linear relationship from a description, a table, or two values. Those standards sit at the point in eighth grade where students stop only interpreting lines and start building them, which is why the 8th grade writing linear equations pdf worksheets weight equation construction so heavily rather than graph reading alone. The work also sets up the slope and intercept reasoning students lean on throughout first-year algebra.
Frequently Asked Questions
What kinds of problems belong on one of these worksheets?
A mix: graphs, tables, two-point problems, direct slope-and-intercept prompts, and real-world contexts. Variety is the point — it shows whether students can recognize a linear relationship across forms or only handle the one they practiced most.
How do I teach students to write an equation from a table or a graph?
Start with the rate of change every time. From a graph, that's rise over run; from a table, it's the constant difference between consecutive y-values. Then find the starting value — the y-intercept on a graph, or the value where x equals zero in a table. If the table doesn't include x equals zero, students substitute one ordered pair to solve for the intercept.
Should eighth graders only work in slope-intercept form?
Slope-intercept form is the main focus because it ties rate of change and initial value together so clearly. Students still benefit from seeing that the same line can be written in equivalent ways, so the more advanced items in the 8th grade writing linear equations pdf worksheets include a few equivalent-form problems without making standard form the central task.













 Interactive Worksheet Maker
 Quiz Maker
 Word Search Maker
 Crossword Puzzle Maker
 Word Scramble Generator
 Sentence Scramble Generator
 Handwriting Worksheet Generator
 Name Tracing Generator
 Fill In The Blank Generator