These 8th grade slope of a line worksheets printable resources give teachers ready-to-use algebra practice across all four major representations — graphs, tables, ordered pairs, and equations — so students build a complete picture of what slope actually measures. The set moves from visual identification of slope direction through calculation and, ultimately, comparison across multiple forms. Print, assign, collect: no extra materials required.
The Specific Skills Each Worksheet Targets
Slope in Grade 8 is not a single procedure. Students need to recognize slope as a rate of change — that is the conceptual anchor — while also being able to extract it from very different visual and numerical setups. Each worksheet in this set focuses on one or more of the following skill areas:
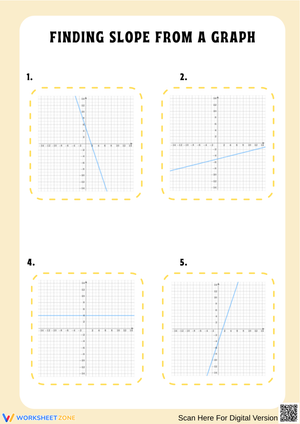
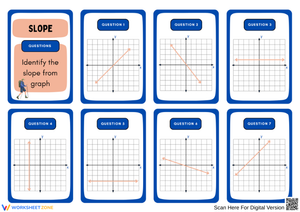
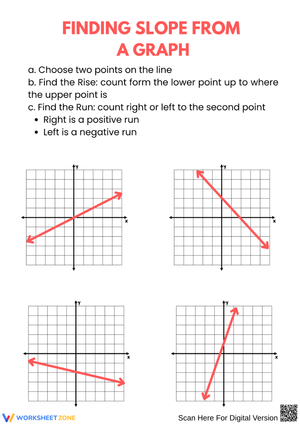
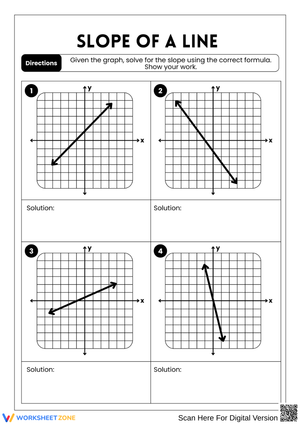
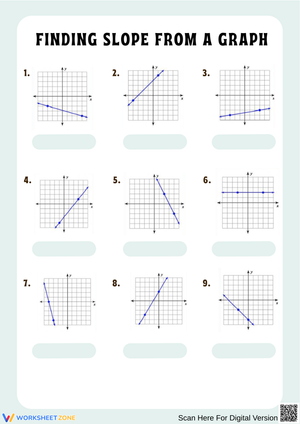
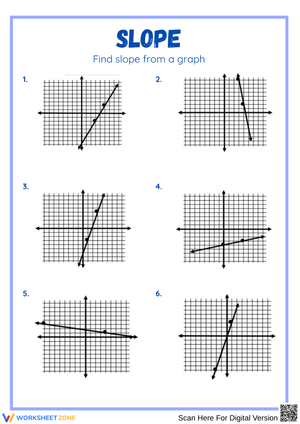
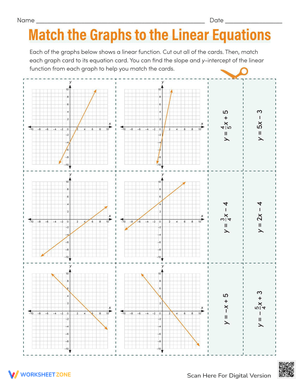
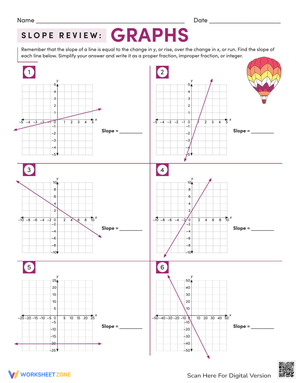
- Slope from a graph: Students count rise over run on clearly labeled coordinate planes, record the value, and identify whether the line is increasing or decreasing.
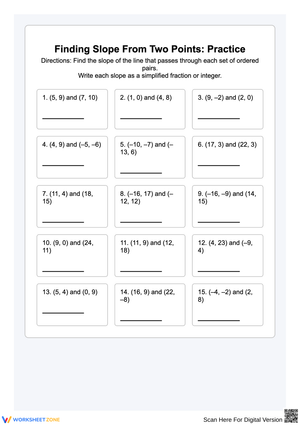
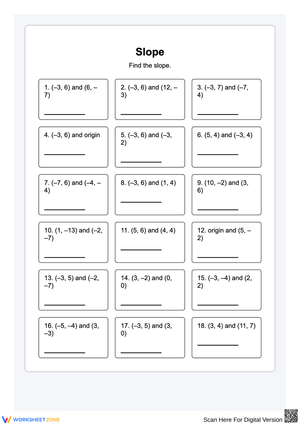
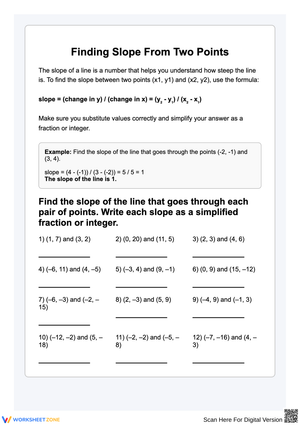
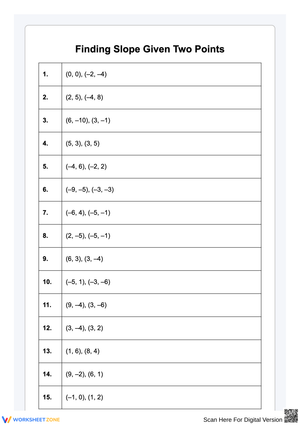
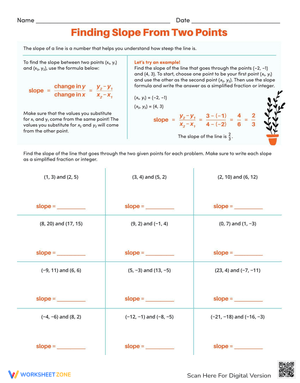
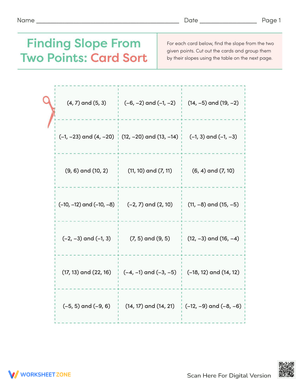
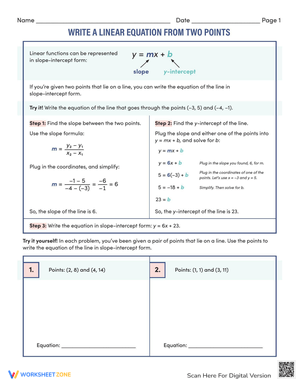
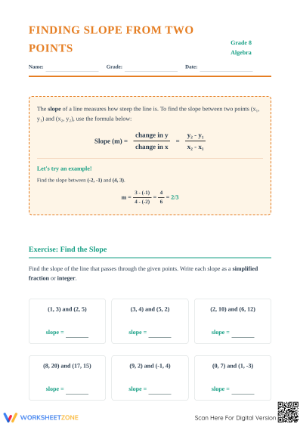
- Slope from two ordered pairs: Students apply the slope formula and track sign carefully when coordinates include negatives.
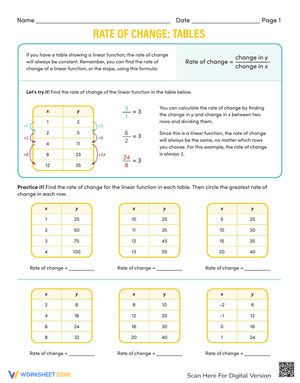
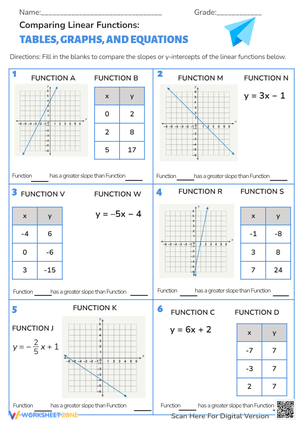
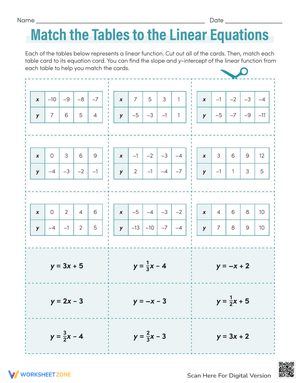
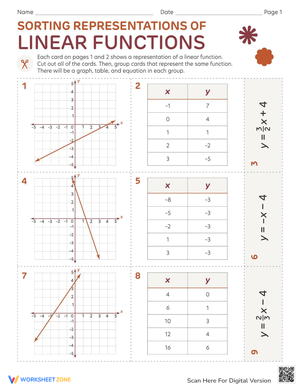
- Slope from a table of values: Students identify constant rate of change across rows, including cases where x-values are not consecutive by 1.
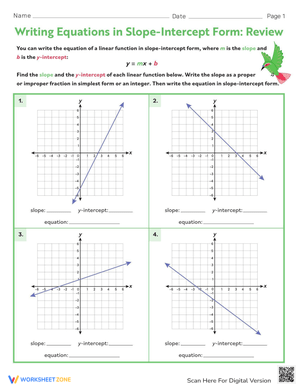
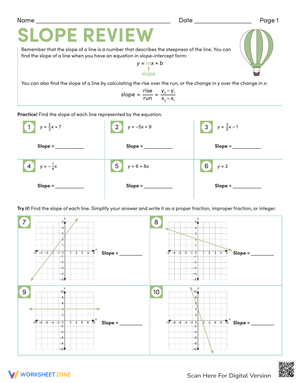
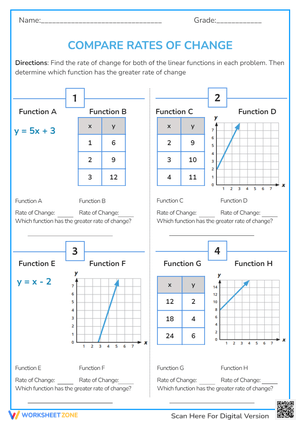
- Slope from a linear equation: Students identify the coefficient of x as slope, both in slope-intercept form and after rearranging from standard form.
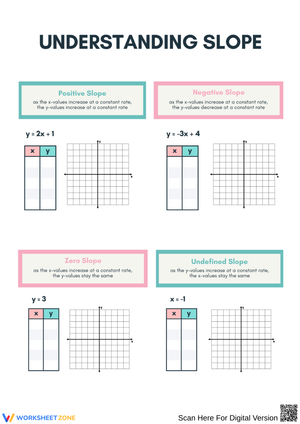
- Slope type classification: Students sort lines or equations into positive, negative, zero, and undefined categories and connect each type to its graph.
The reason all five of these appear together — rather than in isolated packets — is that students trained on only one representation will stall when the format shifts. A student who can count rise over run on a graph often freezes when asked to find slope from a table where the x-values increase by 3. Exposure to all the forms in close proximity builds transferable understanding rather than format-specific recall.
Error Patterns Worth Anticipating Before You Assign the Set
The most common error is rise-and-run reversal: students write run over rise instead of rise over run, producing the reciprocal of the correct answer. This shows up most clearly on graph problems, where students have the visual right in front of them and still invert the ratio. A student who sees a line moving 4 units right and 2 units up will sometimes write 4/2 = 2 instead of 2/4 = 1/2. Catching this on the first few graph problems tells you immediately whether the student has the ratio oriented correctly.
Zero slope and undefined slope cause persistent confusion, often within the same lesson. Students understand intuitively that a flat line "has no slope," and then wrongly apply that same reasoning to vertical lines. The correct distinction is the opposite: a horizontal line has zero slope because the numerator is 0, while a vertical line has undefined slope because the denominator is 0. Students who mix these up in class still mix them up on standardized tests, which is why it is worth returning to horizontal and vertical lines on multiple worksheets rather than treating them as a one-day item.
Table problems produce a third pattern. When x-values increase by 1, students subtract consecutive y-values without trouble. When the x-column jumps by 2 or 3, a meaningful number of students still subtract only the y-values and report that as the slope — ignoring the denominator entirely. This looks like a slope error, but the underlying gap is ratio reasoning. Knowing this in advance helps you ask the right question during a walkthrough rather than simply marking the answer wrong.
Fitting These Worksheets Into Your Instructional Week
The most practical use of 8th grade slope of a line worksheets printable sets is sequenced by representation. Early in the unit, use one worksheet focused entirely on graph-based slope so students can orient a line visually — positive versus negative direction — before formula work begins. That visual foundation makes the leap to ordered pair calculations less abstract.
Mid-unit, a mixed-format worksheet does the heavier lifting. Assign it for independent work during the 20 or so minutes after direct instruction ends, when students need low-overhead practice they can begin without further explanation. If the class runs station rotations, one station on slope from tables and another on slope from equations keeps students moving between representations without losing instructional momentum.
In the week before a unit exam, assign a worksheet or two that pairs slope calculation with slope interpretation — asking students not only to find the value but to explain what it means in a given context. That prompt, even in a printable format, surfaces the difference between procedural fluency and genuine conceptual understanding before the assessment arrives.
Standard Alignment
CCSS 8.EE.B.5 asks students to graph proportional relationships and interpret the unit rate as the slope of the graph — which is why these resources pair slope values with rate-of-change language rather than treating calculation as an end in itself. CCSS 8.EE.B.6 extends that work by asking students to use the concept of similar triangles to explain why slope is constant between any two distinct points on a non-vertical line, and to derive equations in the form y = mx and y = mx + b. The worksheets focused on slope from two points and slope from equations map directly to that expectation. Together, both standards position slope as a foundational idea within the 8.EE domain rather than a standalone calculation skill, and the resources here reflect that framing throughout.
Reaching Different Learners Within the Same Set
The multi-representation format in these 8th grade slope of a line worksheets printable resources makes differentiation relatively straightforward. For students who are still building fluency with integer operations, assign worksheets where coordinate values stay in the range of negative 5 to 5 and where graphed lines pass through clearly visible grid intersections. The slope formula becomes more manageable when students are not also contending with large numbers or fractional coordinates at the same time.
On-level students handle mixed integers across all representations without much difficulty. What extends their thinking is comparison: instead of finding the slope of one line, they find the slopes of two lines from the same graph and explain which is steeper, or they match a table to an equation by checking whether the slopes and intercepts are consistent. These tasks use the same printable worksheet but ask for a different quality of reasoning.
For students who move quickly, ask them to take a completed slope calculation — say, a slope of negative 3/4 — and reverse the process: construct a table with three ordered pairs, sketch a graph with two labeled points, and write a slope-intercept equation that represents the same line. That kind of task does not require a different worksheet. It requires a different question posed to specific students after the assigned problems are done.
Frequently Asked Questions
Which representation is the best starting point for Grade 8 slope instruction?
Graph-based problems work best as the first experience because students can see the direction and steepness of a line before any formula enters the picture. Starting with the slope formula from ordered pairs, before students have a visual reference for what slope looks like, tends to produce students who treat it as a memorized procedure rather than a measurable characteristic of a line.
Do these worksheets include answer keys?
Yes. Answer keys accompany the set, which makes these resources practical for homework, substitute plans, and self-check routines. Having the key available also lets teachers scan returned papers quickly for the specific error patterns noted above — rise-and-run reversal, undefined vs. zero confusion, and denominator omission in table problems — before conferencing with individual students.
How do these worksheets connect to standardized assessment practice?
The 8th grade slope of a line worksheets printable resources in this set include mixed-review problems that reflect the format and variety students encounter on state assessments. Slope appears on most Grade 8 math tests across graph, table, and equation contexts, often alongside questions about proportional reasoning and linear relationships. The later worksheets in the set — the mixed-representation and comparison problems — are strong tools for the review week before a unit assessment.
What do I do when a student understands slope from a graph but loses the thread with the formula?
The bridge that works most reliably is connecting the two methods explicitly. Ask the student to plot the two ordered pairs on a small coordinate grid, then count rise and run before substituting into the formula. After a few repetitions of doing both at once, most students can drop the graph and use the formula alone. The worksheets include problems that require step-by-step work, which means the paper itself shows where the reasoning breaks down — whether that is the subtraction, the fraction, or the sign.