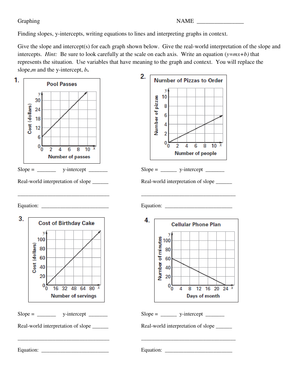
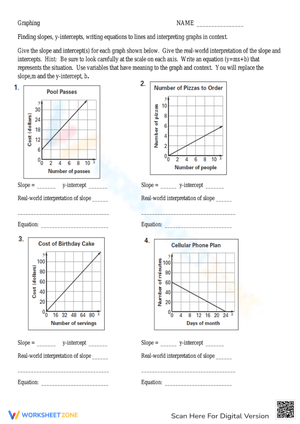
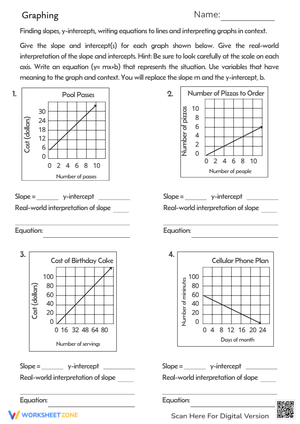
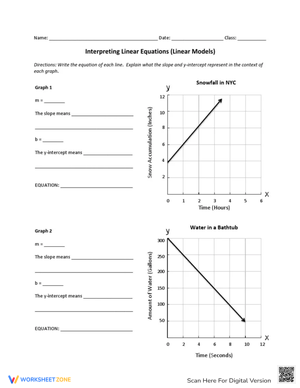
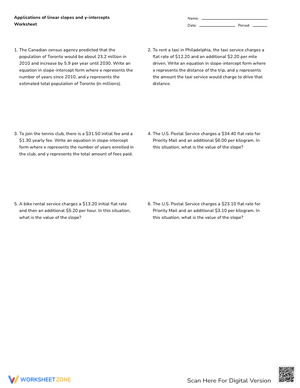
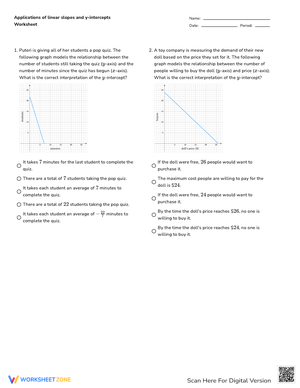
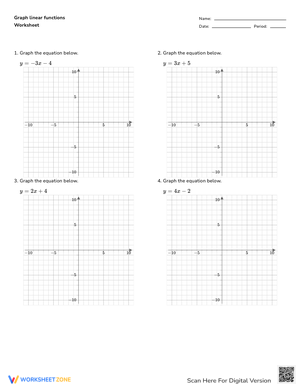
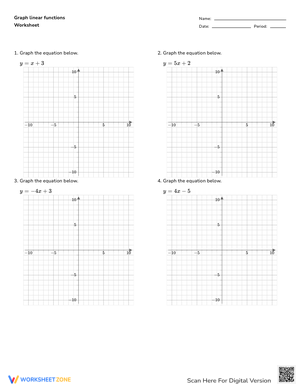
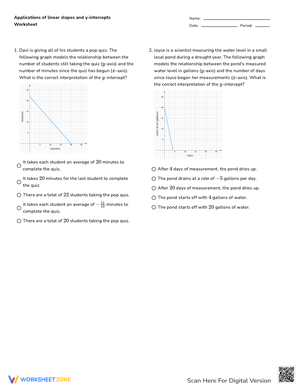
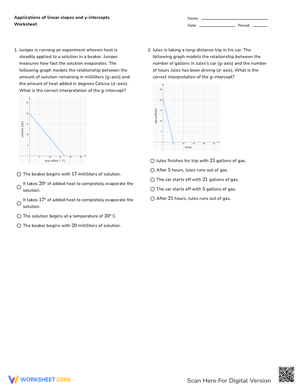
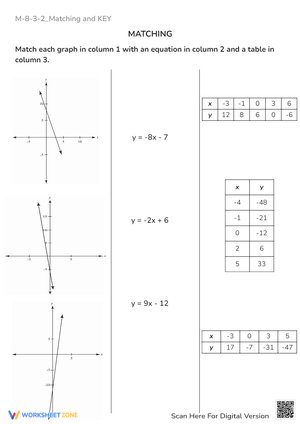
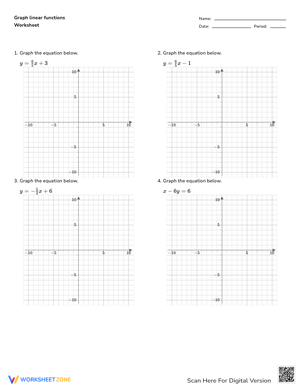
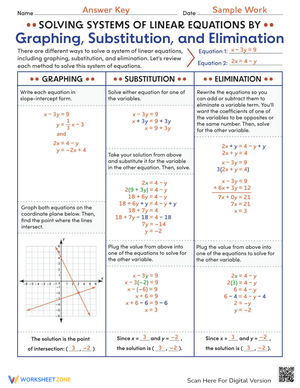
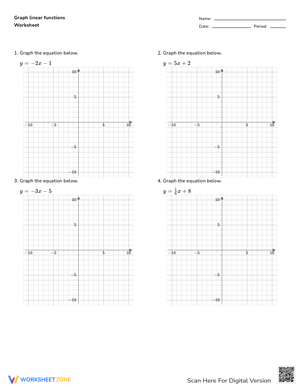
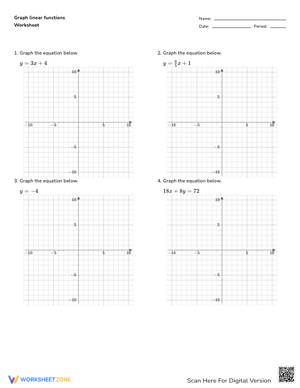
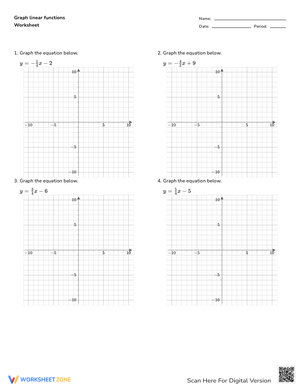
These interpreting slope and y intercept printable worksheets for 8th grade move students past the mechanical step of labeling m and b toward the harder work of explaining what those values describe inside a real context. Each worksheet addresses the two ideas Grade 8 students must hold simultaneously: slope as rate of change and y-intercept as initial value. The tasks require students to work across graphs, tables, equations, and verbal scenarios so the skill transfers rather than stays attached to one input format.
The Specific Skills Targeted
The strongest worksheet sets in this collection push past identification into reasoning. Instead of repeating nearly identical slope-intercept equation problems, the tasks cycle through several related competencies:
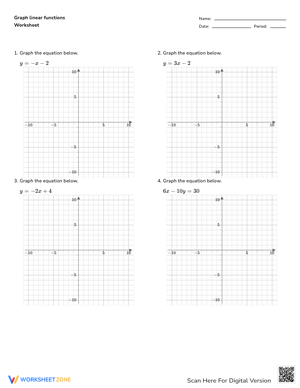
- Extract slope and y-intercept from slope-intercept form equations and state what each value represents.
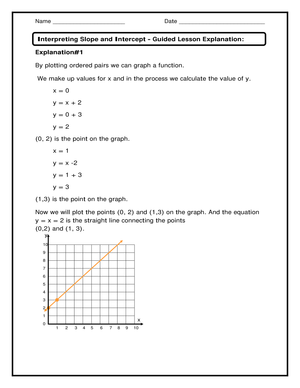
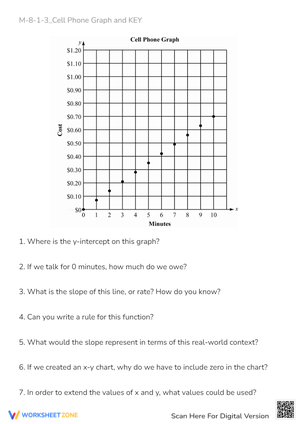
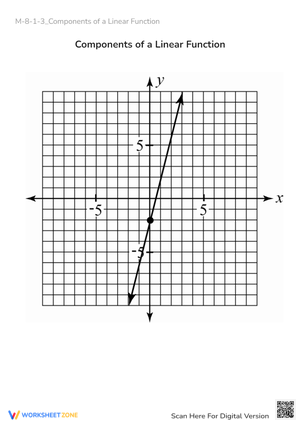
- Read the y-intercept from a graph by locating where the line crosses the y-axis — not just any labeled point on the line.
- Find the rate of change from a table by recognizing consistent differences between output values as the input increases by 1.
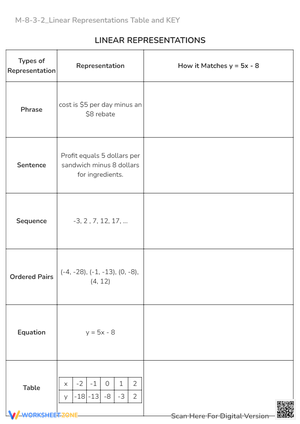
- Match representations — connect a graph, table, equation, and word problem that all describe the same linear relationship.
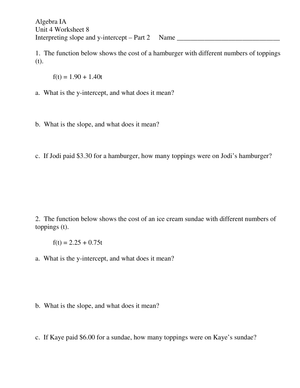
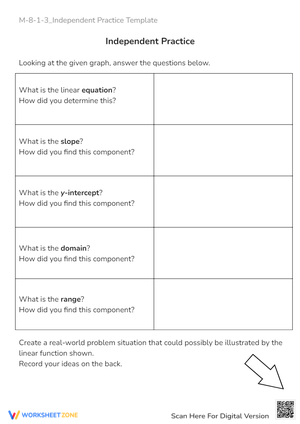
- Write contextual interpretations explaining what the slope and intercept mean inside a specific real-world situation.
- Analyze embedded errors by reading a worked student sample and identifying whether slope or intercept was misapplied or swapped.
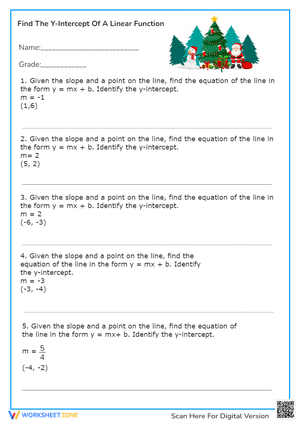
- Write equations from verbal descriptions after first naming the starting value and the rate of change.
A student who extracts 3 from y = 3x + 5 but cannot say "the quantity increases by 3 for every additional unit of x, and the starting value is 5 when x equals 0" has not yet reached the reasoning 8th grade standards require. These worksheets make that gap visible in student work before a unit assessment forces it into view.
Error Patterns Worth Watching for When Students Work These Problems
The most persistent error is not swapping slope and intercept outright — it is confusing any visible labeled point with the y-intercept. Students who see coordinates like (2, 11) marked on a graph will name that as the intercept simply because it stands out. The actual intercept at (0, 7) sits at the graph's edge and gets overlooked. This happens most often when the x-axis does not start at zero, which is why at least some worksheets in the set should include graphs that challenge students to determine whether the visible portion of the graph actually displays the intercept at all.
Several other patterns show up consistently across student work at this level:
- Value reversal in written explanations: Students identify the correct numbers from an equation but assign them to the wrong concept when writing a sentence.
- Context-blind intercepts: A student writes "the y-intercept is negative 3" in a problem about hours worked and total wages, without questioning whether negative hours carry any meaning.
- Rise and run reversed: Students know the formula is rise over run but execute it as run over rise, producing the reciprocal of the actual slope.
- First-number assumption: In a word problem, students treat whichever quantity appears first in the sentence as the y-intercept, regardless of what the situation actually describes.
Worksheets that include prompts like "What does the 6 mean in this situation?" or "Is the y-intercept meaningful here? Explain." slow students down enough to catch these errors before they calcify. Short written explanations surface more diagnostic information than ten additional fill-in-the-blank items do.
Why Familiar Real-World Situations Belong on These Worksheets
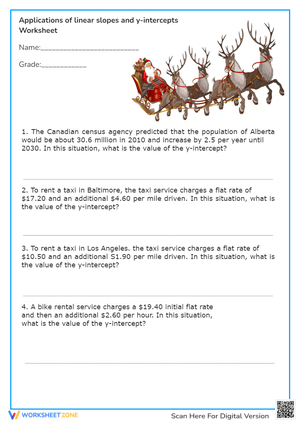
The taxi fare problem remains one of the clearest entry points into this concept because the two values are functionally distinct. A base charge exists before any distance is covered — that is the intercept. Then the per-mile rate takes over — that is the slope. Students can picture the moment the ride begins and the meter running, which makes the algebraic representation feel like a description of something real rather than an arbitrary formula to memorize.
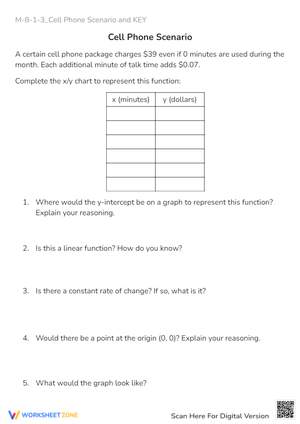
Savings plans, cell phone service fees, and temperature change over time work for similar reasons: each has a visible "before any change" moment. The key classroom move is having students write out what the slope and intercept mean in words before doing anything algebraic. When a student writes "the account starts at $40 and grows by $12 each week" before producing y = 12x + 40, they are far less likely to swap the values or lose track of what each one describes. This verbal-first approach aligns with what Illustrative Mathematics and Open Up Resources both emphasize: explanation and connections across representations come before computation, not after.
How to Build These Worksheets Into Your Lesson Plans
Interpreting slope and y intercept printable worksheets for 8th grade fit several different lesson structures depending on where students are in the unit. During the first week of linear relationships instruction, a five-item warm-up asking only for identification — slope and intercept from equations — keeps the cognitive load low and builds retrieval automaticity before interpretation is added. Once students locate values reliably across equation formats, the interpretation worksheets belong in guided practice, where projecting a single problem and working through it together before releasing students independently helps close the gap between "I know what m is" and "I can explain what m means in this specific situation."
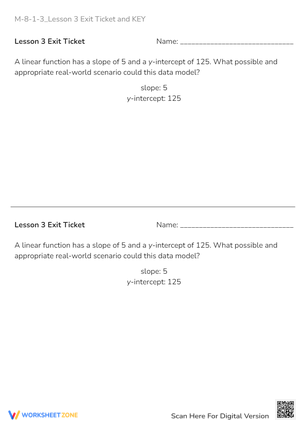
Exit tickets work best when pulled from a shorter, focused worksheet — one graph or one story problem asking students to write one sentence about the slope and one about the intercept. Those written responses show more than five additional identification items do: they reveal whether a student is reasoning or relying on pattern-matching. For homework, the mixed-format worksheets balance straightforward identification with one or two real-world application items, keeping independent work achievable while still requiring some explanation.
A classroom move worth adopting across the whole set: have students mark the y-intercept in one color and the slope in another on every representation. On a graph they circle the intercept point and mark the rise/run pattern. In a table they box the starting value and note the consistent change between rows. In an equation they label m and b. That visual consistency across formats helps many 8th graders see the same mathematical idea without having to re-orient each time the representation changes.
Standard Alignment
This set addresses CCSS 8.F.B.4, which requires students to construct a function to model a linear relationship and determine the rate of change and initial value from descriptions, tables, and graphs — and, critically, interpret both values in terms of the situation being modeled. That interpretation requirement is the operative phrase in the standard: students are not simply asked to locate m and b but to explain them in context. These worksheets sit squarely in that instructional space.
Grade 8 is the formal arrival point for this expectation. Earlier grades introduce proportional reasoning and informal slope through 7.RP.A.2, building constant-of-proportionality understanding that students carry forward — but the full requirement of contextual interpretation of both rate of change and initial value is new at this level. That developmental placement is part of why many students need explicit, repeated practice connecting equations, graphs, and verbal descriptions before the concept holds across formats without prompting.
Adjusting the Worksheets for Different Readiness Levels
Students who need additional support should begin with worksheets that present equations already in slope-intercept form and ask only for identification before adding any interpretation layer. A two-column graphic organizer — "The number" on the left, "What it means in this situation" on the right — reduces the sentence-writing demand while keeping the conceptual work in place. From there, move to tables and then to graphs as students build confidence reading values across formats.
Interpreting slope and y intercept printable worksheets for 8th grade also serve students working above grade level when the prompts shift from identification to justification. Ask these students to evaluate situations where the y-intercept falls outside a realistic domain — a population model where x equals 0 corresponds to a century before records were kept, for example — and to write whether the intercept is mathematically present but contextually meaningless. That distinction extends into high school algebra and data reasoning, so it is worth developing early. For multilingual learners and students who understand the values but need language structure for academic writing, sentence frames like "The slope means __________ changes by __________ for every 1 __________" bridge the gap between grasping the concept and producing an explanation independently.
Frequently Asked Questions
What's the difference between slope and y-intercept, and why does the distinction matter specifically in 8th grade?
Slope is the rate of change — how much y shifts for each increase of 1 in x. The y-intercept is the initial value: what y equals when x is zero. Both concepts appear in narrower forms in earlier grades, but Grade 8 is when students are held accountable for interpreting them in context rather than just computing them. That makes the distinction more than definitional — students need to carry it across graphs, tables, equations, and verbal descriptions simultaneously.
How do I use these when students handle equations fine but freeze on word problems?
Start with the equation form of the same context before presenting the word problem. If students can pull slope and intercept from y = 5x + 20, show them the sentence that generated it: "A gym charges a $20 registration fee plus $5 per month." Have students match the numbers to the sentence before writing any interpretation on their own. Repeated exposure to that equation-to-context pairing reduces the freezing response students have when they encounter only text with no algebraic anchor.
Can the same worksheets serve both new instruction and later review?
Yes — the identification-focused worksheets work for new instruction when students are first learning to locate slope and intercept, while the interpretation and error-analysis worksheets work as review once students have been through the concept at least once. Keeping those uses separate — not mixing heavy interpretation with brand-new vocabulary in the same lesson — gives students a cleaner progression and gives teachers a clearer sense of what students have actually retained.
When is the y-intercept not meaningful in a real-world context problem?
When the input value of zero falls outside the realistic situation. If a worksheet problem models the cost of printing x books, the y-intercept represents the cost when zero books are printed — which might be a fixed setup fee, and that makes sense. But if a problem models a runner's distance remaining and the domain only applies for values of x greater than 0, the intercept exists on the graph without describing anything real. Asking students to make that judgment is one of the strongest conceptual moves these worksheets support.
Which task types give the clearest evidence that students understand the concept rather than guessing?
Written interpretation tasks. When students explain in a sentence what the slope means in a savings situation, or argue whether a y-intercept is meaningful in a specific context, there is no way to produce a correct answer through pattern-matching alone. These interpreting slope and y intercept printable worksheets for 8th grade include enough interpretation prompts that teachers can use student written responses as formative evidence before a unit test — not just as graded output after one.













 Interactive Worksheet Maker
 Quiz Maker
 Word Search Maker
 Crossword Puzzle Maker
 Word Scramble Generator
 Sentence Scramble Generator
 Handwriting Worksheet Generator
 Name Tracing Generator
 Fill In The Blank Generator