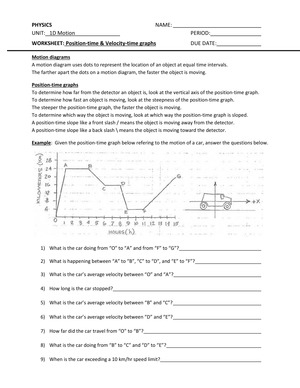
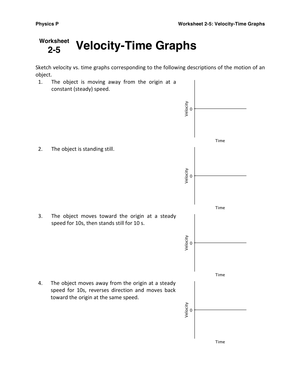
Velocity Time Graph Printable Worksheets for 8th Grade
These velocity time graph printable worksheets for 8th grade give teachers a direct way to bridge two skills students often treat as separate: reading a graph and explaining what it means about an object's motion. At this grade, most students can plot coordinates without trouble, but translating a segment's slope or flatness into a description of changing speed takes deliberate, repeated exposure to varied graph formats. This set builds that interpretive move across several levels of complexity.
The Specific Skills These Worksheets Build
Each worksheet in the set targets a distinct layer of graph analysis, starting with coordinate reading and progressing toward slope and area work. The organizing principle is interpretation before calculation — students should understand what a segment means before they find a number from it.
- Reading velocity and time values from labeled axes
- Identifying intervals of constant velocity versus changing velocity
- Distinguishing increasing from decreasing velocity by slope direction
- Describing motion in complete sentences using graph evidence
- Calculating acceleration from a segment's slope using integer values
- Estimating or calculating displacement from the area under the graph
- Matching a velocity-time graph to a short written motion scenario
The displacement-from-area tasks deserve particular attention at this level. When the regions are simple rectangles and right triangles with whole-number dimensions, students can connect a visual shape to a real quantity — how far the object traveled — rather than applying a formula they have no reason to trust. That grounding matters for what follows in physical science.
Common Student Errors to Watch For and Address
The most persistent error is treating a velocity-time graph as a position-time graph. A student who sees a line rising from left to right will say "the object is moving upward" or "it's getting further from the start" — reading the vertical axis as literal distance rather than as speed. This confusion appears even in students who handle coordinate tasks well, because it's conceptual, not procedural. A reliable correction: have students write the word velocity next to the y-axis before answering anything. That small step forces them to restate what the axis actually measures before they begin interpreting.
Two related errors follow closely. First, students confuse slope with height — a tall, nearly flat line gets labeled "fast acceleration" because the graph appears to reach a high point, while a short but steep line gets called "slow" because the velocity values are small. Placing a worked comparison at the top of a worksheet — two line segments side by side, one tall-and-flat and one short-and-steep — corrects this faster than a written definition. Second, when a segment drops below the x-axis, many 8th graders say the object stopped or returned to its starting point. Asking students to annotate every segment with a motion phrase — moving forward, slowing down, reversing — before any calculation addresses this consistently, because it demands a physical interpretation of each segment before the numbers arrive.
Building These Worksheets Into Your Week
Spreading interpretation before calculation across three to five class sessions gives students time to build a coherent picture of motion rather than a collection of disconnected procedures. Starting with slope calculation before students can describe what a segment means produces knowledge that falls apart the moment an assessment asks for a written explanation.
- Day 1: Read axis values, identify coordinates, describe segments as flat or sloped.
- Day 2: Compare intervals — which segment shows the greatest velocity increase? Which shows constant speed?
- Day 3: Introduce slope as acceleration using graphs with clean integer values and two clear segments.
- Day 4: Introduce displacement from area using graphs where the regions are rectangles and right triangles.
- Day 5: Mixed review — graph-to-scenario matching, short written responses, and an exit ticket that asks students to explain what both the slope and the area of one segment each represent.
Velocity time graph printable worksheets for 8th grade also fit naturally into the last five to eight minutes before a class transition. A graph with two targeted questions gives students something purposeful to work through while the teacher wraps up, and the annotation step — writing a motion phrase on each segment — makes visible in real time whether students understand what the graph is showing or are still confusing the axes.
Standard Alignment
In mathematics, these worksheets align to CCSS 8.F.B.5, which asks students to describe the qualitative relationship between two quantities by analyzing a graph and identify where a function is increasing, decreasing, or constant. The velocity-time context gives that standard a physical grounding: a horizontal line isn't just "neither increasing nor decreasing" — it's an object holding a steady speed. In science, the materials connect to NGSS MS-PS2-2, which addresses investigations involving motion patterns and forces. The slope-to-acceleration work directly supports the data interpretation demands of that performance expectation, giving students graph-reading practice before they encounter a full lab write-up.
Adapting the Set for a Range of Learners
For students who need more support, choose worksheets with whole-number axis increments, two or three graph segments, and sentence frames for written responses. A frame like From __ to __ seconds, the object is moving at a constant velocity of __ m/s because the graph is __ reduces the language demand without removing the interpretive thinking. A partially completed first segment — where the annotation and one calculation are already shown — gives students a model to follow without doing the conceptual work for them.
Velocity time graph printable worksheets for 8th grade at an extension level work best as two-graph comparisons: two cyclists whose velocity-time graphs have different slopes over the same time interval, with students identifying which has greater acceleration, explaining how they know, and calculating the total displacement difference. These tasks require students to hold multiple quantities in mind simultaneously and construct a reasoned written argument — a meaningfully different demand than reading a single graph alone.
- For support: fewer segments, whole-number scales, written sentence frames, partially worked examples
- For on-level: mixed formats including short answer, multiple choice, and scenario matching
- For extension: two-graph comparisons, multi-interval displacement totals, and open-ended written justifications
- For partner work: one student annotates the segments while the other drafts the written description, then they swap roles on the next graph
Frequently Asked Questions
What should students practice first when they are new to velocity-time graphs?
Segment interpretation — reading each part of the graph and describing in words what the object is doing — comes before any calculation. Students who move straight to slope formulas without understanding what a flat line or a downward slope means will make errors they cannot catch, because they have no physical intuition to check against. Start with description and add numbers once motion language is in place.
How do I know when a student is ready to move from description to slope calculation?
Give the student a two-segment graph and ask them to write one sentence about each segment before computing anything. If they can identify that the first segment shows constant velocity and the second shows increasing velocity and can point to the graph feature that tells them so, they are ready for slope. If they describe the graph as "going up and then flat" without mentioning velocity or motion, stay with interpretation for another session before introducing the formula.
Can science teachers use these resources without a math co-teacher?
The slope calculation on velocity time graph printable worksheets for 8th grade uses the same rise-over-run reasoning students already see in 8th grade math, so science teachers can reference that prior knowledge directly. A brief verbal reminder — velocity on the y-axis, time on the x-axis, change in y divided by change in x gives acceleration — is usually enough for students who have already encountered slope. No reteaching of the algebra from scratch is needed.
How do these worksheets function as formative assessment rather than just practice?
Collect the annotation step, not just the final answer. If a student labels a downward-sloping segment as "constant velocity," that tells you something specific about what needs correcting. If their displacement calculation is wrong but their segment annotations are accurate, the error is arithmetic rather than conceptual. The visible thinking on a printed graph gives more diagnostic information than a circled number alone, and it takes about thirty seconds to read per student.
Clear All