Why Ecological Pyramids Worksheet Belong in The Ecosystem Unit
When a life science unit moves from food chains to energy flow, students hit a wall: the idea that energy shrinks as it climbs the levels feels invisible. Ecological pyramids worksheets turn that abstract loss into something students can draw, measure, and defend. Instead of memorizing that energy is simply lost, your class builds a stacked diagram where each trophic level is visibly smaller than the one below it, and the numbers on the page explain exactly why that happens.
This page pulls together printable pyramid models, fill-in diagrams, and calculation practice you can drop into a grades 5-8 ecology sequence. Each sheet supports the producers, consumers, and decomposers work you have likely already started, so pyramids extend the unit rather than restart it. Every worksheet uses plain kilocalorie values and clear trophic labels so you can hand them out with minimal setup, whether you are teaching a full ecology unit or reviewing before a state test.
The Three Types of Ecological Pyramids
Students often assume there is only one pyramid. There are three, and each answers a different question about an ecosystem.
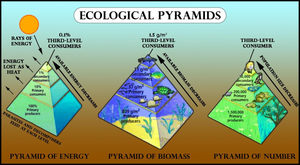
- Pyramid of energy shows how much energy, usually in kilocalories, is available at each trophic level. It is always upright.
- Pyramid of biomass shows the total mass of living things at each level at one point in time.
- Pyramid of numbers counts individual organisms at each level, from producers up to top consumers.
Worksheets that place all three side by side help students see that a single ecosystem can be described in three ways, and that the three pyramids do not always look identical. Encourage students to notice that the pyramid of numbers can spike or shrink depending on organism size, a detail that comes back later when pyramids invert. That comparison is the setup for one of the most useful teaching moments in the whole unit.
Teaching the 10% Energy Rule With Real Numbers
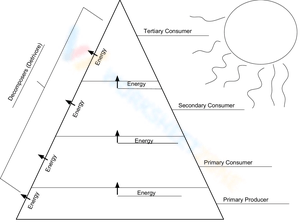
The core concept in an energy pyramid is the 10% rule: only about 10% of the energy at one trophic level passes to the next. The other 90% is lost, mostly as heat released through metabolic processes like movement, respiration, and staying warm. Worksheets that ask students to calculate energy at each level make this concrete. Point out that the lost energy never disappears from the universe; it leaves the food chain as low-grade heat, which keeps the first law of thermodynamics intact for students who ask.
Give students a base of 1,000 kcal stored in grass. A grasshopper eating that grass captures roughly 100 kcal. A shrew eating grasshoppers gets about 10 kcal, and a hawk at the top receives just 1 kcal. Watching a four-figure number collapse to a single digit in three steps does more to explain why food chains rarely exceed four or five links than any definition can. Ask students to circle where 90% of the energy went at each step, and the heat-loss idea stops being a phrase to memorize.
NGSS Alignment and What It Asks Students to Do
These worksheets map directly to a middle school ecology standard.
NGSS MS-LS2-3 asks students to develop a model describing how matter cycles and energy flows among the living and nonliving parts of an ecosystem. The performance expectation centers on that one model, and a student-built ecological pyramid that tracks energy across all 3 trophic levels meets it as direct evidence of understanding.
When a Pyramid Flips: Inverted Biomass and Numbers
Energy pyramids are always upright because energy is always lost between levels. Biomass and numbers pyramids can be inverted, and that surprise is a great discussion prompt. In many aquatic ecosystems, fast-growing phytoplankton have a small standing biomass at any moment but reproduce so quickly they feed a much larger mass of zooplankton above them. The biomass pyramid looks upside down even though energy still flows normally.
A pyramid of numbers can also invert. One large oak tree, a single producer, can support hundreds of insects, so the consumer level holds more individuals than the producer level. Worksheets that include an inverted example push students past the pyramids are always wide at the bottom shortcut and toward real reasoning. Have them justify each inverted case in writing to surface any lingering misconceptions.
Using These Worksheets In Real Classes
Here is a sequence that works across a class period without heavy prep.
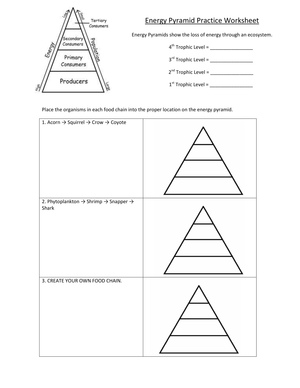
- Open with a completed model. Hand out a labeled energy pyramid and have students annotate where energy is lost. This anchors vocabulary before any math.
- Move to calculation. Give a starting kcal value and have students fill each level using the 10% rule.
- Build from a scenario. Provide a short local ecosystem description and have students construct their own pyramid from scratch.
- Compare pyramid types. Ask small groups to decide whether numbers, biomass, or energy best answers a given question.
For intervention groups, shrink the pyramid to three levels and supply the organism cards, so students focus only on the energy relationship instead of managing every variable at once. Rotating groups through these four steps over two class periods also gives you natural checkpoints to catch misconceptions early.
Frequently Asked Questions
1. What is the difference between an energy, biomass, and numbers pyramid?
An energy pyramid shows kilocalories available at each level, a biomass pyramid shows the total mass of organisms, and a numbers pyramid counts individual organisms. Energy pyramids are always upright, while the other two can sometimes be inverted.
2. Why is only about 10% of energy passed to the next level?
Roughly 90% of the energy at each trophic level is used for life processes and lost as heat through respiration and movement. Only the remaining 10% is stored as body tissue the next level can eat, which is why top predators receive so little.
3. What grade level usually covers ecological pyramids?
Ecological pyramids most often appear in grades 5-8 life science, especially in middle school ecology units covering producers, consumers, decomposers, and trophic levels.
4. Can a pyramid of numbers or biomass be inverted?
Yes. A single large producer like a tree can support many consumers, inverting a numbers pyramid, and fast-reproducing phytoplankton can support a larger biomass of zooplankton, inverting a biomass pyramid. Energy pyramids never invert.
5. How can teachers assess understanding formatively?
Quick exit tasks work well: have students calculate a missing level with the 10% rule, explain an inverted pyramid, or label trophic levels on a blank diagram. Each takes about five minutes and reveals misconceptions right away.












 Interactive Worksheet Maker
 Quiz Maker
 Word Search Maker
 Crossword Puzzle Maker
 Word Scramble Generator
 Sentence Scramble Generator
 Handwriting Worksheet Generator
 Name Tracing Generator
 Fill In The Blank Generator