These graphing linear equations worksheets pdf for 9th grade give Algebra 1 teachers a ready-to-print set covering slope-intercept form, coordinate graphing, tables of values, and equation writing — the full cluster of skills students need to carry into systems of equations and beyond. Each worksheet includes clean coordinate grids, working space for calculations, and an answer key that makes independent practice, station work, and sub plans workable without extra preparation.
The Specific Skills This Set Targets
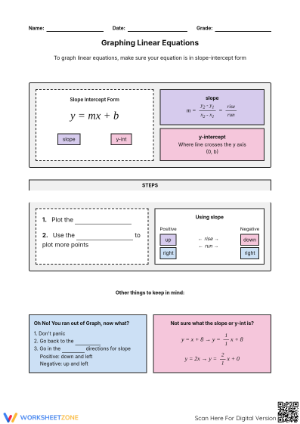
A well-organized set of graphing linear equations worksheets pdf for 9th grade addresses linear relationships from multiple entry points because the HSA standards don't ask students merely to draw lines from slope-intercept equations — they ask students to represent solutions graphically, read slope and intercepts from a coordinate grid, and move fluidly between symbolic and visual forms. A student who can only graph from y = mx + b will hit a wall the first time a problem hands them two points or a contextual scenario.
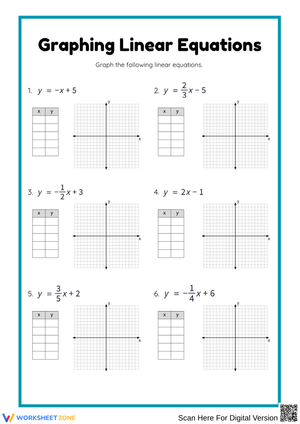
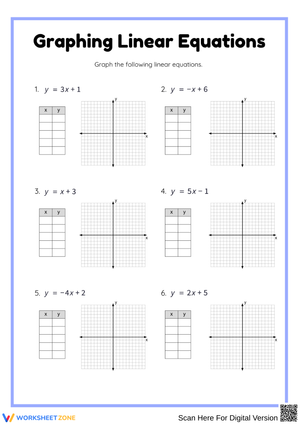
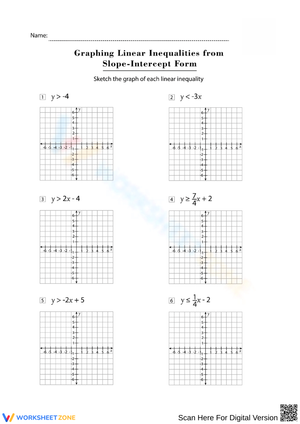
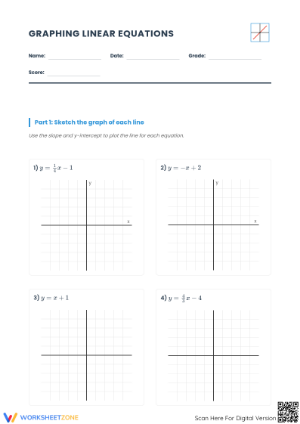
- Graph from slope-intercept form: Students identify the y-intercept, apply slope to locate a second point, then draw the line accurately across the grid.
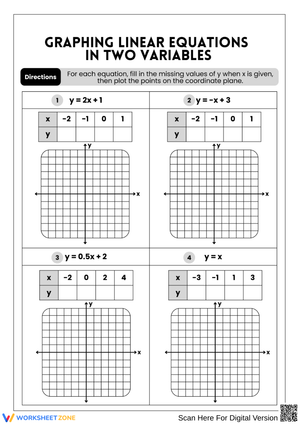
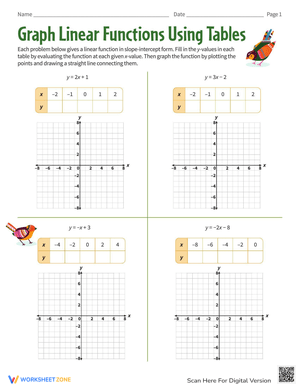
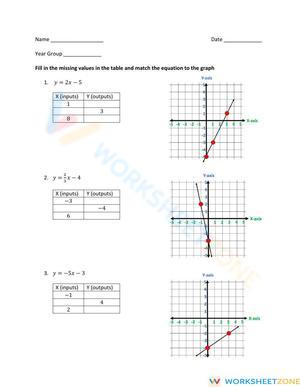
- Build and plot from a table of values: Students complete ordered pairs, plot each point, and observe constant rate of change directly on the grid before any formula appears.
- Graph a line through two given points: Students plot both coordinates first, connect them, extend the line, and identify slope from rise over run.
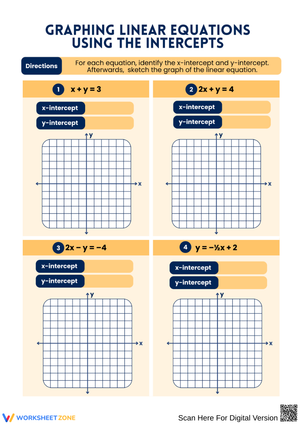
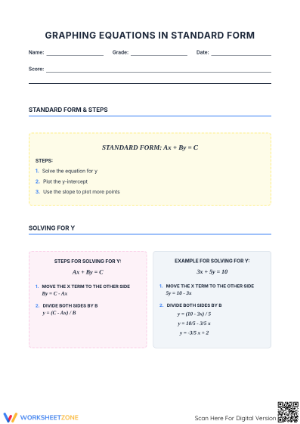
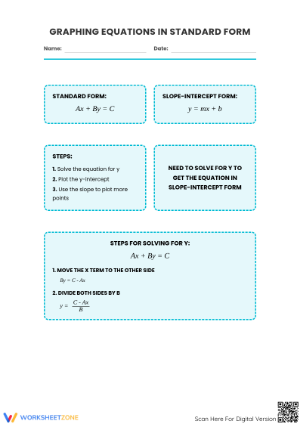
- Convert from standard form before graphing: Students rearrange Ax + By = C to slope-intercept form — a step that reveals whether algebraic manipulation and graphing are actually connected in a student's thinking.
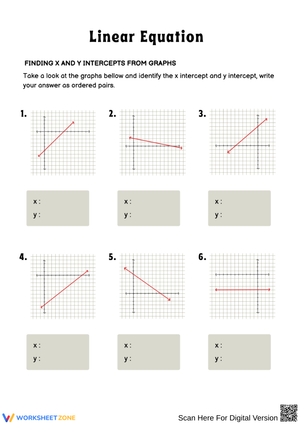
- Write an equation from a graph: Students identify slope and y-intercept visually, then produce the symbolic form of the line.
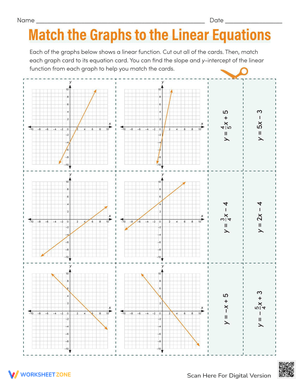
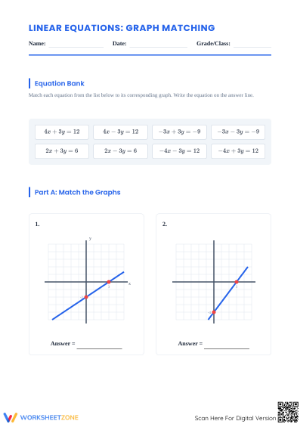
- Multi-representation matching: Tasks requiring students to link an equation, a table, and a graph for the same line — the most direct test of whether conceptual flexibility is actually there.
- Interpret slope and y-intercept in context: Problems where numbers carry real meaning, so students practice connecting procedure to understanding rather than stopping at a drawn line.
Graphing Errors That Surface in Every Algebra 1 Class
The most consistent error at this level: a student working with y = 2x + 3 correctly names the slope as 2 and the y-intercept as 3, then marks the starting point at (3, 0) on the grid instead of (0, 3). The vocabulary is memorized; what "y-intercept" actually means on a coordinate plane has not been internalized. This mistake appears in September, and it reappears reliably after winter break in January.
Negative slopes produce a second predictable problem. Given y = −⅔x + 1, a student starts at the correct y-intercept and moves two units to the right — then moves three units upward instead of downward. The negative sign belongs to the rise, not the run, but students who treat "rise over run" as directional shorthand without sign awareness flip this about half the time. The resulting line has positive slope and looks plausible, especially when students skip checking a second point before connecting.
A third pattern worth watching: students who place the y-intercept correctly and then sketch the slope by eye rather than computing a second plotted point. The line looks approximately right from across the room, but reading intercepts off it produces wrong values. Any worksheet that requires students to label a second calculated point before drawing the line interrupts this before it becomes habit.
Where These Worksheets Fit in a Daily Algebra 1 Lesson
A worksheet with two or three graphing problems is the right size for the first eight minutes of class. Students graph from slope-intercept form while attendance gets taken and materials come out, and the teacher can scan the room for y-intercept placement errors before those mistakes get reinforced by repetition. Slightly longer sets — four to six problems mixing graphing and equation-writing — suit the last portion of a guided lesson when students transition from notes to independent work.
Station rotation works particularly well with these resources. Assign one worksheet per station: the first focused on completing tables and plotting points, the second on graphing directly from equations, the third on reading a graph and writing the equation from it. Rotating every 12 to 15 minutes keeps momentum up, and students who are strong at mechanical graphing but weak at reverse-engineering an equation from a visual surface quickly at the third station — that's useful information before the next assessment.
Teachers using these graphing linear equations worksheets pdf for 9th grade for test review report that the equation-writing task is the clearest diagnostic. Students who have been getting by on pattern-matching in graphing stall almost immediately when the direction reverses, and that stall is exactly what review time is for.
Standard Alignment
These worksheets align primarily to HSA-CED.A.2 (create equations in two variables and graph them to represent relationships) and HSA-REI.D.10 (the graph of an equation in two variables is the set of all its solutions plotted in the coordinate plane). In most Algebra 1 pacing guides, both standards appear early in the course — typically within the first or second linear relationships unit — after students have reviewed rational number operations but before work on systems of equations begins.
The multi-representation matching tasks also address HSF-IF.C.7a, which asks students to graph linear functions and show intercepts and slope. Teachers whose Algebra 1 course is organized around the functions strand rather than the equations strand will find those tasks especially well-placed for that standard's instructional context.
Tiering the Practice for a Mixed-Ability Algebra 1 Class
Print two versions of the same worksheet: one with a partially completed table of values, one without. Students who need additional support use the version with the table to concentrate on accurate plotting and recognizing the linear pattern; students who are ready work directly from the equation. Both groups stay on the same objective and participate in the same whole-class debrief. The graphing linear equations worksheets pdf for 9th grade set includes problems formatted to support this kind of parallel use without making the difference in task visible across tables.
For students ready for more depth, add problems where the slope's absolute value is greater than 1 — something like −5/2 or 7/3 — or where the context requires interpreting what the y-intercept represents in a real-world scenario involving a starting value or flat fee. Those additions change the cognitive demand without requiring a completely different worksheet. For students still building accuracy with point plotting, the table-based worksheets provide a useful intermediate step: students see the coordinates as a list before placing them on the grid, which separates the arithmetic task from the spatial one.
Frequently Asked Questions
Should I teach graphing from tables before introducing slope-intercept form?
Yes, for most Algebra 1 classes. When students complete a table, plot the points, and watch a line form on the grid, slope becomes something observable before it becomes a formula. Starting with y = mx + b asks students to trust a procedure before they have a mental model of what it produces. Most teachers who sequence the table-based worksheets first report fewer y-intercept placement errors once students move to slope-intercept form.
How many problems per worksheet works for in-class practice versus homework?
For in-class independent work, four to six problems gives students enough practice to check their accuracy, catch their own errors, and still have time for a brief whole-class debrief before the period ends. For homework, six to eight is manageable if the set mixes graphing with short interpretation or equation-writing questions. Pure mechanical repetition of the same graphing step stops producing meaningful learning after about the fifth identical problem.
How do I use these for intervention with students who are significantly behind?
Use the worksheets with the largest grids and fewest problems per session — typically two or three. Students in intervention often lose plotting accuracy not because they misunderstand slope but because a cramped grid makes precise point placement nearly impossible. Work through the first problem together before releasing students to work independently, and use the table-based format so students have an explicit intermediate step between the equation and the grid. Students making the y-intercept/x-intercept confusion described in the errors section benefit most from targeted work on that single error before returning to the full mixed set.
Do these worksheets still serve a purpose if students have access to graphing calculators?
Yes. Calculator fluency depends on spatial understanding, not the other way around. A student who has never plotted a line by hand has no anchor for recognizing a scale error, a mistyped equation, or a graphing window that cuts off the relevant portion of the line. Hand-graphing practice gives students the reference model that makes calculator output interpretable rather than just accepted.