


Views
Downloads
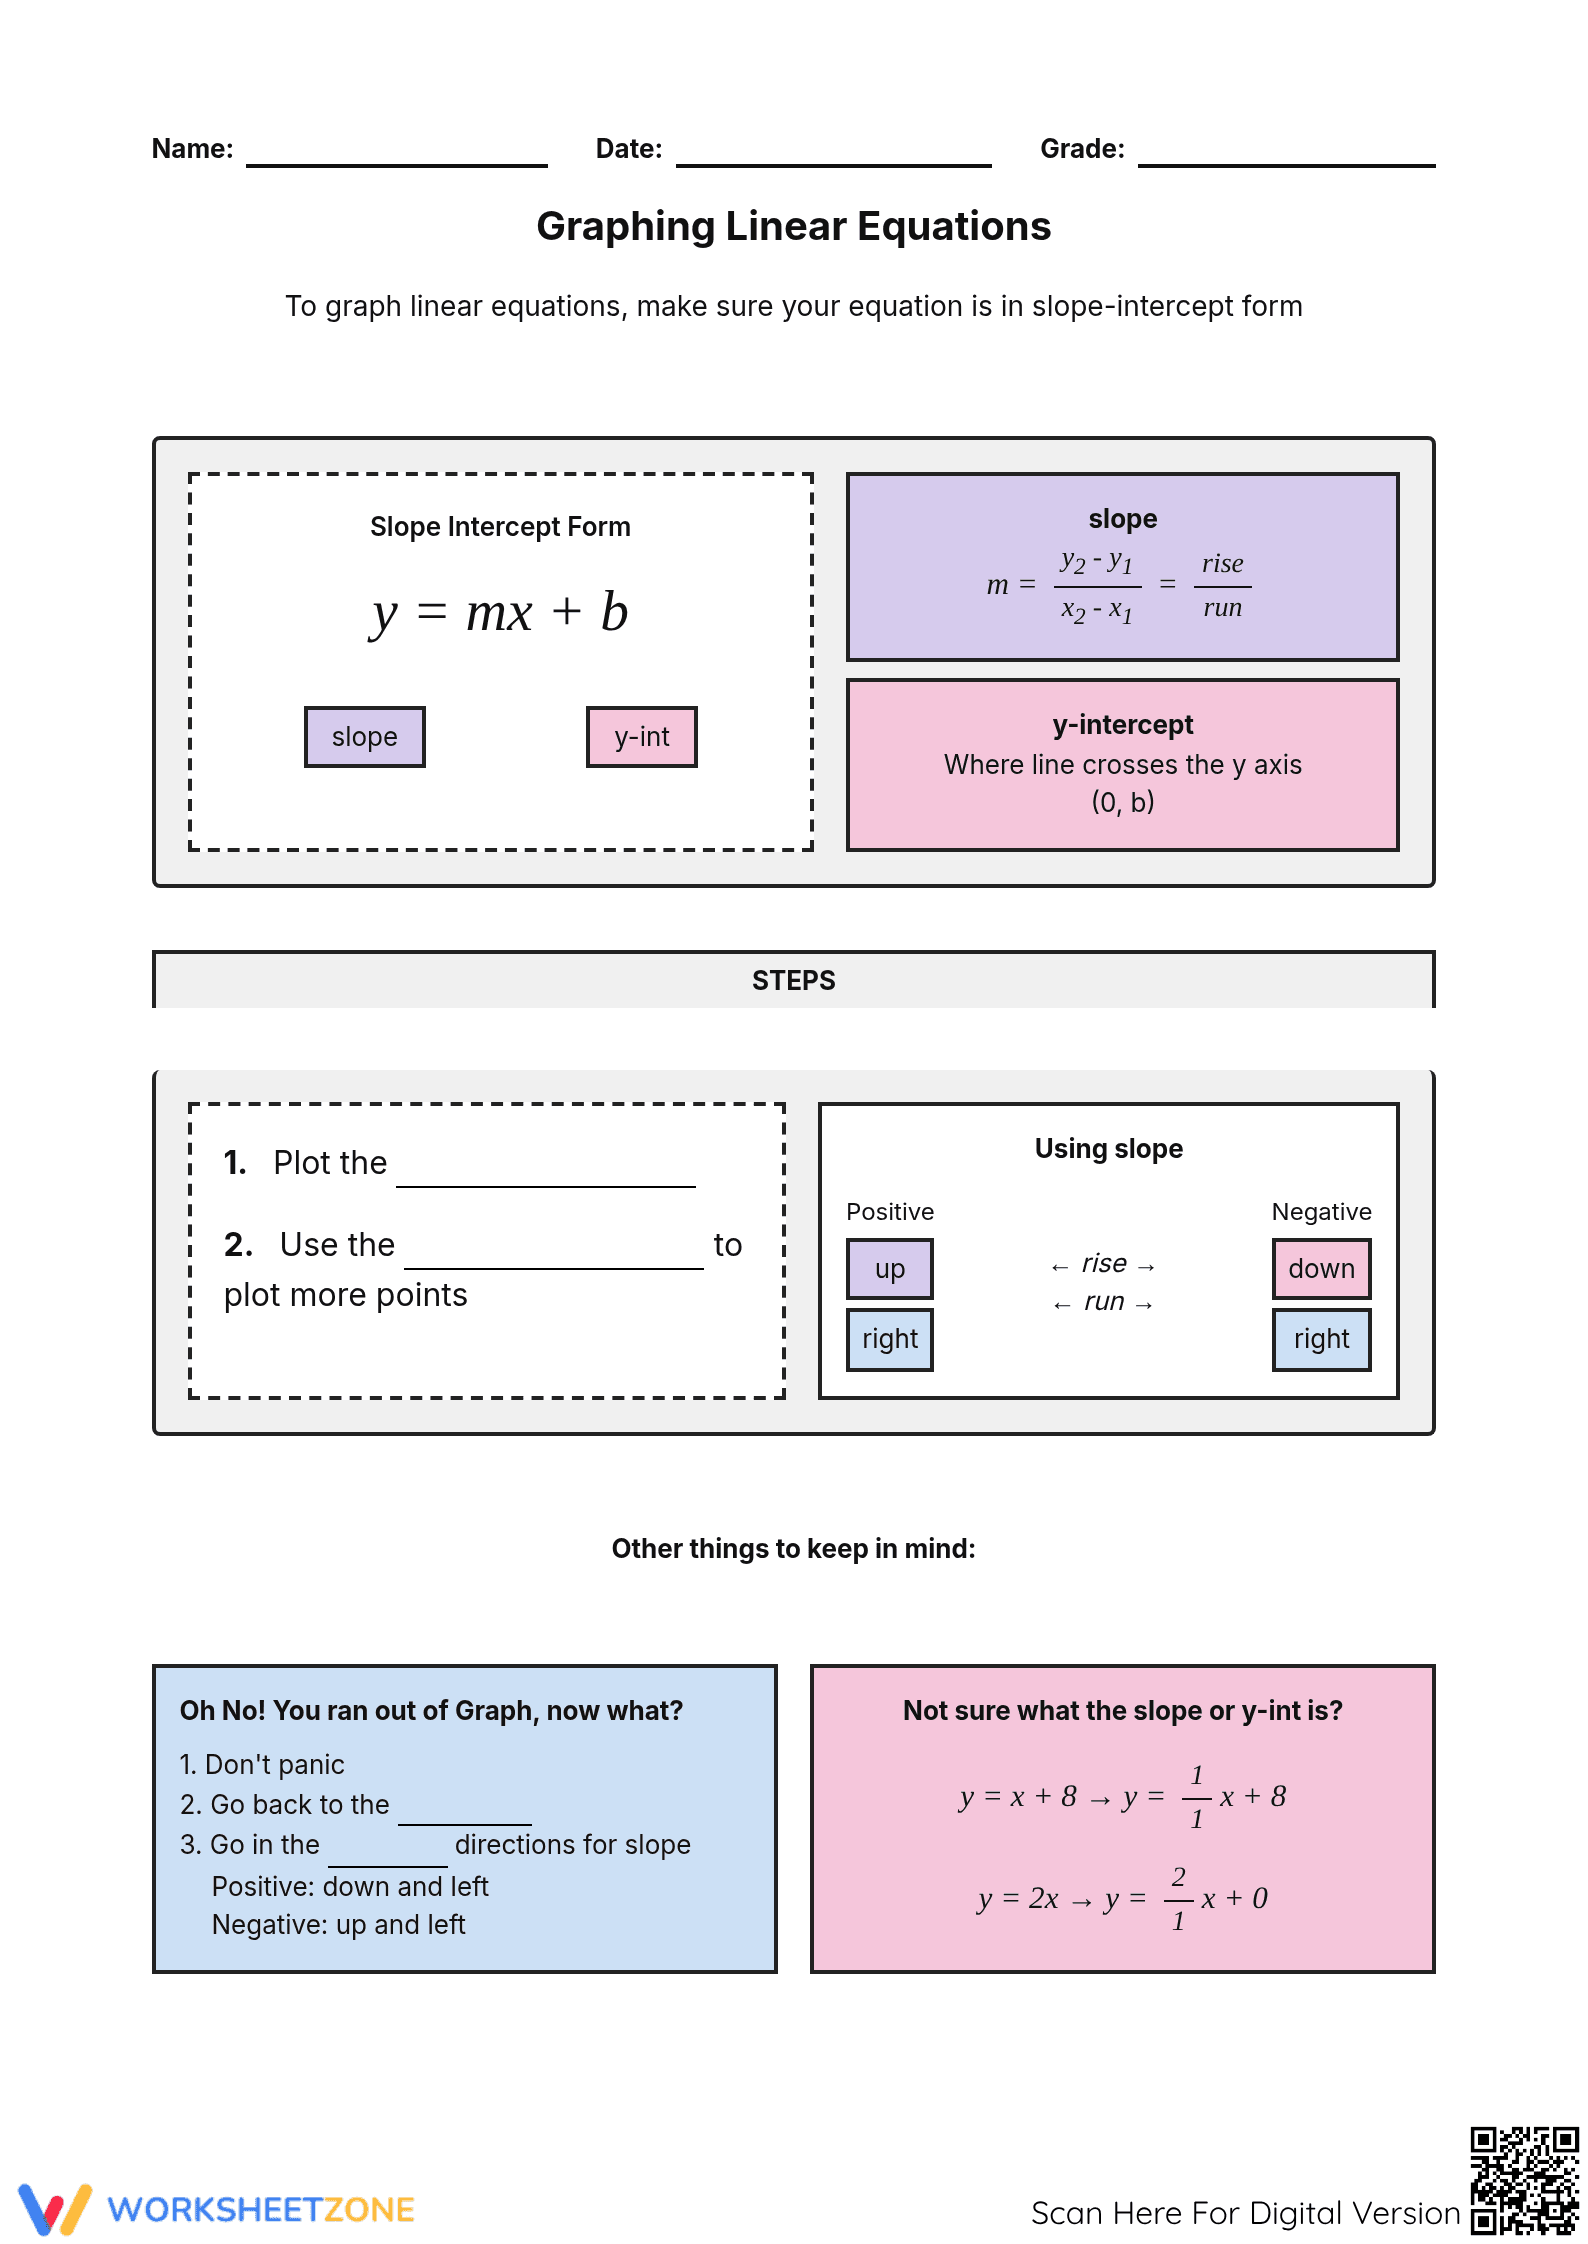


Printable Graphing Linear Equations Worksheet | HS Math
Paste this activity's link or code into your existing LMS (Google Classroom, Canvas, Teams, Schoology, Moodle, etc.).
Students can open and work on the activity right away, with no student login required.
You'll still be able to track student progress and results from your teacher account.
These printable notes provide a structured introduction to graphing linear equations for high school math students. The 3-page resource covers graphing from tables and using the slope-intercept form (y = mx + b), with practice problems to build procedural fluency in algebra or pre-algebra courses.
At a Glance
- Grade: 8–12 · Subject: Math
- Standard:
CCSS.MATH.CONTENT.HSF-IF.C.7.A— Graph linear functions and show intercepts.- Skill Focus: Graphing Linear Equations
- Format: 3 pages · 4 problems · Answer key included · PDF
- Best For: Guided notes, introductory practice, concept review
- Time: 20–35 minutes
What's Inside
This three-page PDF contains guided notes and practice. The first page defines key vocabulary like slope and y-intercept with a worked example. Subsequent pages teach two methods: graphing from a table of values and using slope-intercept form. Each method includes two "your turn" problems for independent practice, totaling 4 problems. A complete answer key is included.
A Structured Path to Graphing
This resource uses a gradual release model to guide students from concept to application.
- Guided Practice: The first page acts as an anchor chart, defining concepts with a fully worked example of graphing y = 2x + 1.
- Supported Practice: The next pages provide step-by-step instructions and examples for graphing from a table and using the slope-intercept form.
- Independent Practice: Each method concludes with two "Your Turn" problems (4 total) for a quick check for understanding.
Standards-Aligned for Your Classroom
This worksheet is directly aligned with Common Core standard CCSS.MATH.CONTENT.HSF-IF.C.7.A, which requires students to graph linear functions and show intercepts. It also supports foundational concepts from Grade 8 (8.F.A.3). Both codes can be copied directly into lesson plans or curriculum maps.
How to Use in Your Classroom
Use this packet during direct instruction, projecting the pages as you introduce the concepts. The worksheet is also an effective resource for review or homework. For a quick formative assessment, circulate as students complete the four "Your Turn" problems, observing their process with tables or the "rise over run" slope method. Expect completion in 20-35 minutes.
Who It's For
This resource is designed for students in Grades 8-10 first learning to graph linear functions, or for older students needing a concise review. The step-by-step format is accessible for all learners. Pair this with a digital tool like Desmos to deepen the connection between the equation and its graph.
This resource provides structured practice for a critical gateway skill in algebra: graphing linear functions, as specified in standard CCSS.MATH.CONTENT.HSF-IF.C.7.A. By connecting the abstract representation of an equation to a concrete visual graph, students develop a deeper conceptual understanding of functions. Research consistently shows that procedural fluency built on a conceptual foundation is key to long-term success in mathematics. As noted in the RAND AIRS (2024) report on effective math instruction, explicit teaching of foundational procedures combined with opportunities for independent practice is a high-impact strategy. This worksheet provides exactly that, breaking down the process into manageable steps—graphing from tables and from the slope-intercept form—and giving students a chance to apply their learning. Its focus on the y = mx + b form provides the essential building block for understanding more complex function families later on.