These 9th grade velocity time graph worksheets pdf resources give physics and introductory science teachers a set of standalone practice worksheets covering three core skills: reading the slope of a line segment as acceleration, calculating displacement from the area under the graph, and interpreting multi-stage motion scenarios that combine constant speed, speeding up, and slowing down within a single journey. Each worksheet presents a pre-drawn, axis-labeled velocity-time graph followed by structured calculation and interpretation tasks — students extract numbers from the graph, label units, and explain in writing what the graph's features mean about the object's actual motion.
What Each Worksheet Asks Students to Do
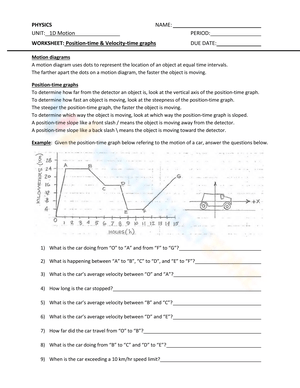
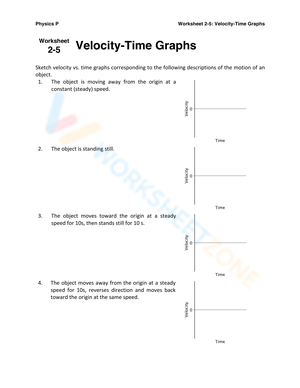
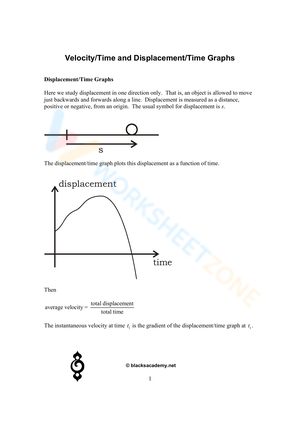
The calculation tasks across the set move from simpler to more demanding within each worksheet. Students start by identifying the velocity at a specific instant — just reading the y-value — then calculate the slope of a single segment by choosing two grid-intersection points and applying (v2 - v1) / (t2 - t1). From there, each worksheet asks them to find the displacement for one segment, then for a full multi-segment journey. That final step requires decomposing the area under the graph into rectangles and triangles, calculating each piece separately, and summing the signed results. When the graph line dips below the time axis, the area in that region counts against total displacement — a detail the tasks require students to address explicitly.
Several worksheets also include short written-response items: mark the interval of greatest acceleration, identify when the object is momentarily at rest, and describe in one sentence what a below-axis segment says about direction. These items are quick to complete but reliably reveal whether a student has conceptual understanding or is executing calculation steps without knowing what they mean.
Patterns of Error Worth Watching For
The most stubborn misconception at this level is treating the height of a line as the acceleration value. A student who sees a horizontal line sitting at 8 m/s on the y-axis will write "acceleration = 8 m/s²" without hesitation, because the y-value is the most prominent number visible and the word "velocity" hasn't fully replaced the word "speed" in that student's thinking. Correcting this requires a direct statement — a flat line means zero acceleration, regardless of how high it sits — and then the repetition that comes from marking five or six segments across a worksheet.
A second predictable error surfaces when the graph line crosses the x-axis. Students calculate the area of the below-axis region correctly but then add it as a positive number, ignoring the direction reversal the sign change represents. Asking students to shade above- and below-axis regions in two different colors before calculating forces the issue into the open. A third pattern: when told to find the slope of a labeled segment, students default to the graph's overall final point minus its overall first point, skipping the segment markers entirely. Requiring students to circle the target segment and write out the coordinates of both chosen points before touching the formula reduces this significantly.
Fitting These Worksheets Into a Kinematics Unit
The best time to introduce the 9th grade velocity time graph worksheets pdf set is immediately after a live motion demonstration — a two-minute walk toward and away from a motion sensor while students watch the graph build in real time. That physical anchor makes the abstract connection between slope and acceleration visible before students ever touch a pencil. Once the demonstration ends and the three key graph features are named (flat = constant velocity, positive slope = speeding up, negative slope = slowing down), the worksheets carry the practice load.
- Bell-ringer, Day 2 of kinematics: One worksheet in the opening ten minutes while the previous night's reading is still accessible — this surfaces calculation gaps before the rest of the lesson commits to assuming fluency.
- Mid-unit formative check: Collect a completed worksheet unannounced, scan responses for area-sign errors, and address the pattern at the start of the next class before introducing kinematic equations.
- End-of-unit review: Reserve one or two worksheets so students work through the full slope-and-area procedure in a format they already know, freeing attention for the physics rather than for decoding new task instructions.
Standard Alignment
These worksheets address NGSS HS-PS2-1, which asks students to analyze motion data and connect that analysis to explanations about force and change in velocity — the velocity-time graph is the primary data format for that standard in most introductory physics courses. They also connect to CCSS.MATH.CONTENT.HSF-IF.B.4, which targets interpreting key features of graphs and tables in context, including slope and area. That overlap matters for scheduling: a well-built 9th grade velocity time graph worksheets pdf lesson counts toward physics instruction and reinforces a math standard students are often still consolidating from Algebra I, which makes it defensible as time well spent in both departments.
Adapting the Set Across Ability Levels
For students who get stuck at the area-identification step — meaning they can apply the formula but can't yet see which geometric shape the region forms — annotate a copy of each worksheet before distributing it: trace the bounding rectangle or triangle directly on the graph, label the base and height, and let students take over from there. That removes one cognitive layer without gutting the mathematical work. It isn't the full task, and students who need this support should move toward the unannotated version as soon as their accuracy stabilizes.
Students who complete the standard tasks quickly benefit from a reversal challenge: given the velocity-time graph, sketch the corresponding acceleration-time graph. That requires translating each segment's slope into a horizontal bar at the correct acceleration value — a genuinely harder task that previews the derivative relationship students will meet formally in AP Physics or calculus. For English language learners, the graph format carries natural accessibility because most of the information is visual. The written-response items need sentence frames; the calculation tasks do not.
Frequently Asked Questions
How do students know which two points to use when finding slope?
They should choose two points that land exactly on grid intersections within the segment being analyzed — not the graph's overall start and end. Requiring students to circle the target segment and write out the coordinates of both chosen points before calculating eliminates most of the wrong-point errors that appear in student work.
What does a below-axis region mean for displacement?
When the velocity line drops below the time axis, the object is moving in the negative direction. The area of that region is negative displacement and subtracts from any positive displacement accumulated while the line was above the axis. Students who add all areas as positive values get a total distance, not a displacement — and catching that distinction is one of the more useful formative moments these tasks generate.
Do the worksheets transfer to digital or remote settings?
The 9th grade velocity time graph worksheets pdf format works well in both contexts. Teachers upload each worksheet to a learning management system; students open the file on any device, annotate using a stylus or PDF markup tool, and submit digitally. The graph grids display cleanly on screens — no resolution loss that changes the reading of a coordinate point — so the task transfers without adjustment.