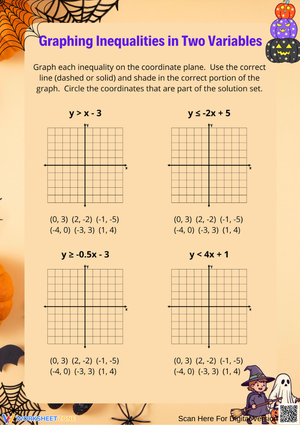
These 9th grade graphing linear inequalities worksheets pdf resources give Algebra 1 teachers a ready-to-print set of practice materials organized around each discrete step of graphing on the coordinate plane — drawing the correct boundary line, selecting and evaluating a test point, shading the right half-plane. Each worksheet isolates one stage of that process rather than asking students to hold every procedural demand in working memory at once, which matters most in the first days of the unit when the concept is genuinely new and the steps are stacking up fast.
Frequent Student Errors Worth Catching Early
The most consequential mistake in this unit isn't a shading error — it's a sign error that happens before students reach the graph. When a student rearranges -2y less than 4x + 6 and divides both sides by -2, forgetting to reverse the inequality symbol, they write y less than -2x - 3 instead of y greater than -2x - 3. The boundary line plots correctly because the equation of the line is identical either way, but the shaded region falls on the wrong side of it. When you mark this wrong, the student often can't locate the error because the line itself looks perfectly fine. That's the painful part: a graph that looks nearly finished is hiding an algebraic error two steps back.
The second pattern worth flagging is what happens when students lean on the memorized rule "shade above the line for greater than, shade below for less than." That shortcut holds reasonably well when the equation is already in slope-intercept form, but it collapses completely with vertical lines. A student who sees x greater than 4 has no "above" or "below" to reference. The test point method transfers to every case: substitute the coordinates of a point not on the boundary line, evaluate whether the inequality statement holds, and shade the region that contains that point when the statement is true. For most problems, the origin is the fastest test point available — with the one caveat that it can't be used when the boundary line passes directly through it.
Skills These Worksheets Build
Each worksheet in this 9th grade graphing linear inequalities worksheets pdf set addresses one procedural step, so teachers can sequence practice deliberately across the unit rather than jumping straight to multi-step problems. The skills covered across the set include:
- Identifying whether a given inequality requires a dashed or solid boundary line before touching the graph
- Converting inequalities from standard form to slope-intercept form, with particular emphasis on cases involving negative leading coefficients on y
- Graphing boundary lines from slope and y-intercept
- Writing out test point substitutions and evaluating the resulting numerical statement
- Shading the correct half-plane and confirming the choice against the test point result
- Graphing single-variable inequalities on the coordinate plane, including vertical and horizontal boundary lines
- Error analysis exercises where students examine a pre-completed, incorrectly shaded graph and identify the specific mistake
Those error analysis worksheets deserve separate attention because they flip the usual task. Instead of producing an answer, students evaluate one that's already there — and wrong in a specific, deliberate way. Students who shade accurately on their own worksheet sometimes can't articulate why a neighbor's incorrect answer is wrong. The analysis format surfaces that distinction and turns it into a teaching moment.
How to Work These Worksheets Into Your Instructional Week
On the day you introduce graphing linear inequalities, use the boundary-line identification worksheet as a warm-up before any full graphing. It takes about eight minutes and gives you a quick read on which students have the dashed-versus-solid distinction sorted before they pick up a ruler. From there, move into direct instruction and follow it with a guided-practice worksheet that separates the graphing task into three labeled stages: draw the line, mark the test point, shade. Keeping those stages visually distinct reduces the number of students who rush to shade before confirming the line type.
A station rotation works well on the second or third day, once students have moved through the full process at least once. One station handles standard-form conversion problems without any graphing, so students can focus entirely on the algebraic manipulation and the sign-flip rule. A second station presents slope-intercept problems with the boundary line already drawn — students make only the shading decision. A third station uses error-analysis worksheets as a paired discussion task. This structure lets you circulate to the conversion station, which is where most of the intervention work happens. At the end of the unit, a mixed-format worksheet makes a clean Friday formative before the class advances to systems of linear inequalities.
One practical note on shading: ask students to use a highlighter or colored pencil rather than graphite. Pencil shading fills the coordinate grid and makes it nearly impossible to confirm at a glance whether the boundary line is dashed or solid — the first thing most teachers check. A single light pass with a yellow or pink highlighter keeps the plane readable and speeds up grading considerably.
Standard Alignment
These worksheets address HSA-REI.D.12, which directs students to graph the solution set of a linear inequality in two variables as a half-plane, excluding the boundary when the inequality is strict. In standard Algebra 1 sequencing, this standard lands after students have graphed linear equations in slope-intercept and standard form and before they move into systems of linear inequalities. That placement matters instructionally: students who aren't yet fluent with y = mx + b graphing will hit a wall here, because the inequality version adds new decision points on top of procedural skills that must already be automatic. The 9th grade graphing linear inequalities worksheets pdf resources in this set are written to fit that instructional window — after the equation-graphing unit closes, before the transition to systems begins.
Reaching Students at Different Readiness Levels
Students who are still unsteady on slope-intercept graphing need a different entry point. Give them inequalities already written in slope-intercept form to remove the conversion step, and consider pre-drawing the boundary line on the coordinate plane so they work exclusively on the shading decision. That approach isolates the new learning — the half-plane reasoning — without layering it on top of skills that aren't yet solid. Once they demonstrate consistent accuracy on those focused tasks, introduce standard-form problems incrementally.
For students who move through the material quickly, the most productive challenge is harder constraint conditions rather than more problems of the same type. Assign standard-form inequalities with negative leading coefficients on y, present boundary lines that pass through the origin so students must choose a test point other than (0, 0), or ask them to write the inequality themselves from a word-problem context before graphing it. A problem like "a student has at most $40 to spend on supplies, where notebooks cost $3 and pens cost $2 each" requires translating a real constraint into a graphable inequality — a layer of reasoning that extends well beyond the procedural core of the unit. The 9th grade graphing linear inequalities worksheets pdf set includes those applied problems as extension material for students who need the push.
Frequently Asked Questions
My students' boundary lines look correct, but the shading keeps landing on the wrong side. Where's the error?
Almost always, the problem is in the algebraic conversion, not the shading step. A student who divided both sides by a negative number and didn't reverse the inequality symbol will have the right line but the wrong direction for the shaded region. Have the student return to the original inequality and rewrite the conversion from scratch, specifically flagging the division step to check whether the symbol was flipped. Once the algebra is corrected, the shading resolves on its own.
Why can't students always use the origin as their test point?
When the boundary line passes through (0, 0), substituting zero for both variables places the test point directly on the line — and a point on the boundary is neither inside nor outside the solution region. The substitution can't tell students which half-plane to shade. In those cases, teach students to pick a simple nearby point like (1, 0) or (0, 1). It's worth building the habit of checking visually whether the line runs through the origin before assuming it's available as a test point.
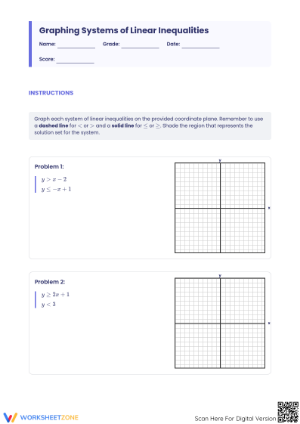
Do these worksheets cover systems of linear inequalities, or only single inequalities?
Each worksheet covers single-inequality graphing. Systems — where students identify the intersection of two shaded half-planes — typically follow as a separate unit in the Algebra 1 sequence. The fluency students build here with boundary lines, test points, and half-plane reasoning transfers directly to that unit, but the worksheets in this set don't cross into system-graphing territory.
How do students graph a single-variable inequality like x greater than 5 on the coordinate plane?
Vertical and horizontal inequalities follow the same logic as two-variable problems, just with a single-variable boundary line. For x greater than 5, students draw a dashed vertical line at x = 5 and shade the region to the right, covering all x-values that exceed 5. For y less than or equal to -2, the boundary is a solid horizontal line at y = -2, with shading below representing all y-values at or below that threshold. The test point method works identically here — substitute a point's coordinates into the original inequality, evaluate, and shade the region that makes the statement true.