


Views
Downloads
Grade 9 Graphing Lines — Printable No-Prep Worksheet
Paste this activity's link or code into your existing LMS (Google Classroom, Canvas, Teams, Schoology, Moodle, etc.).
Students can open and work on the activity right away, with no student login required.
You'll still be able to track student progress and results from your teacher account.
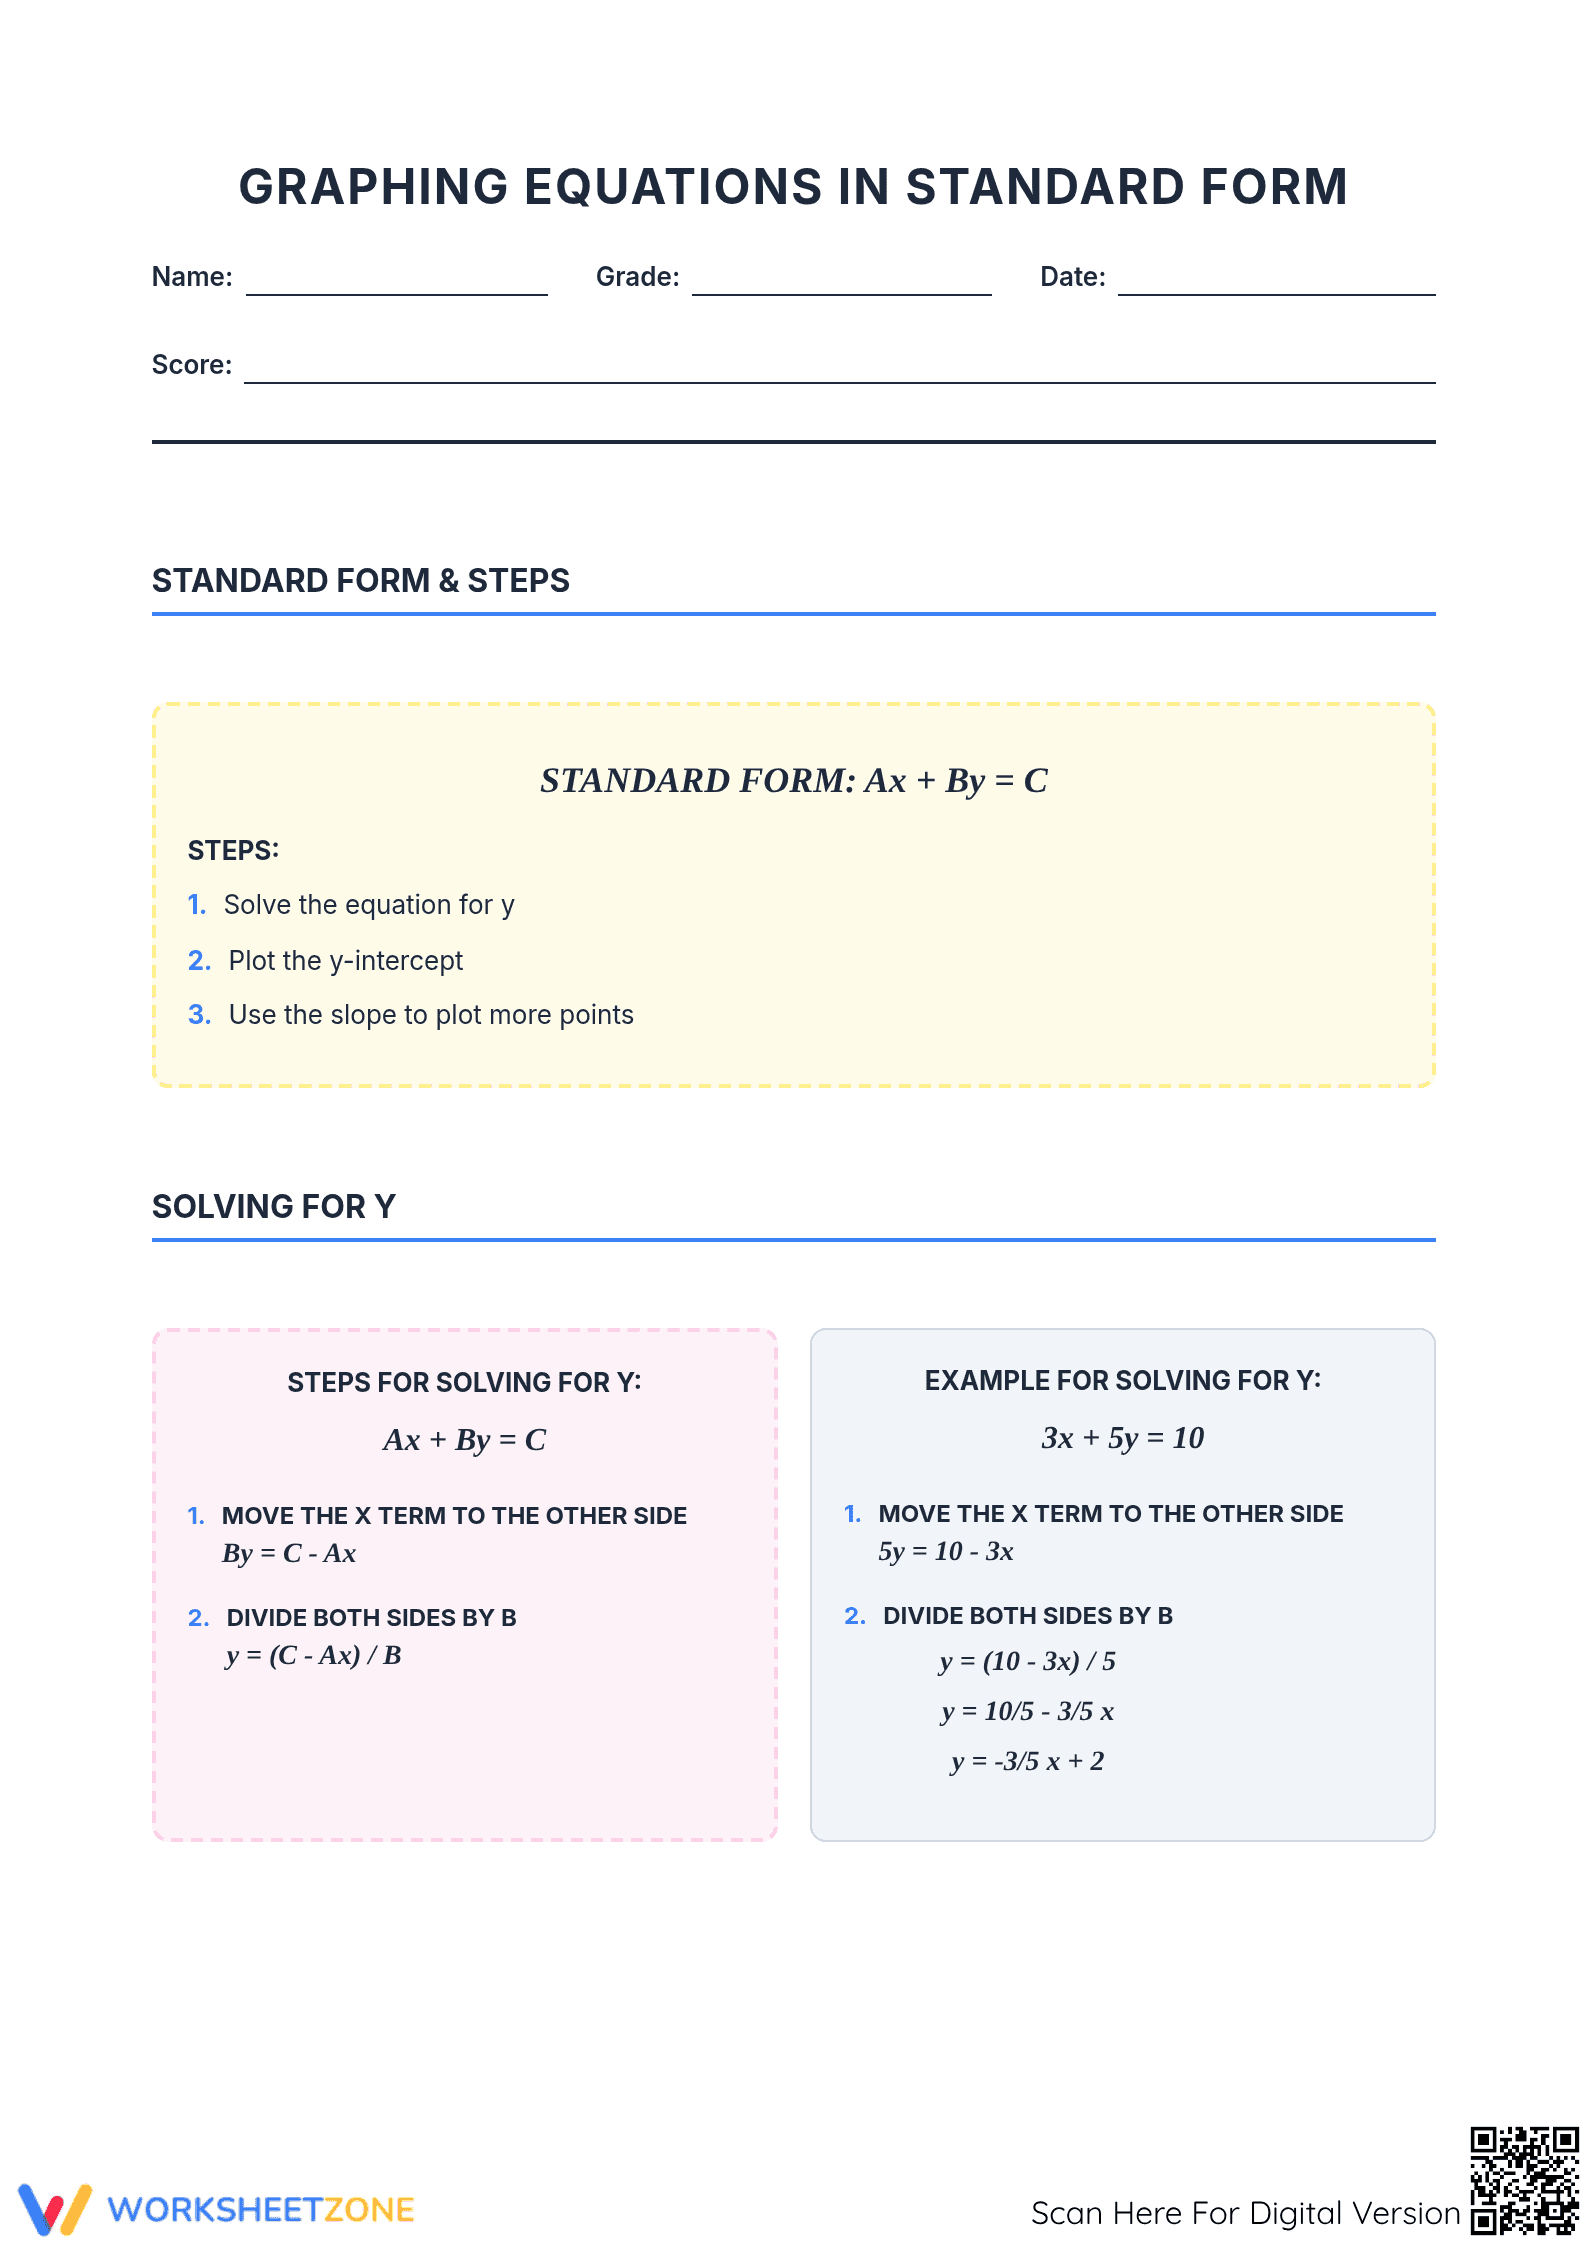
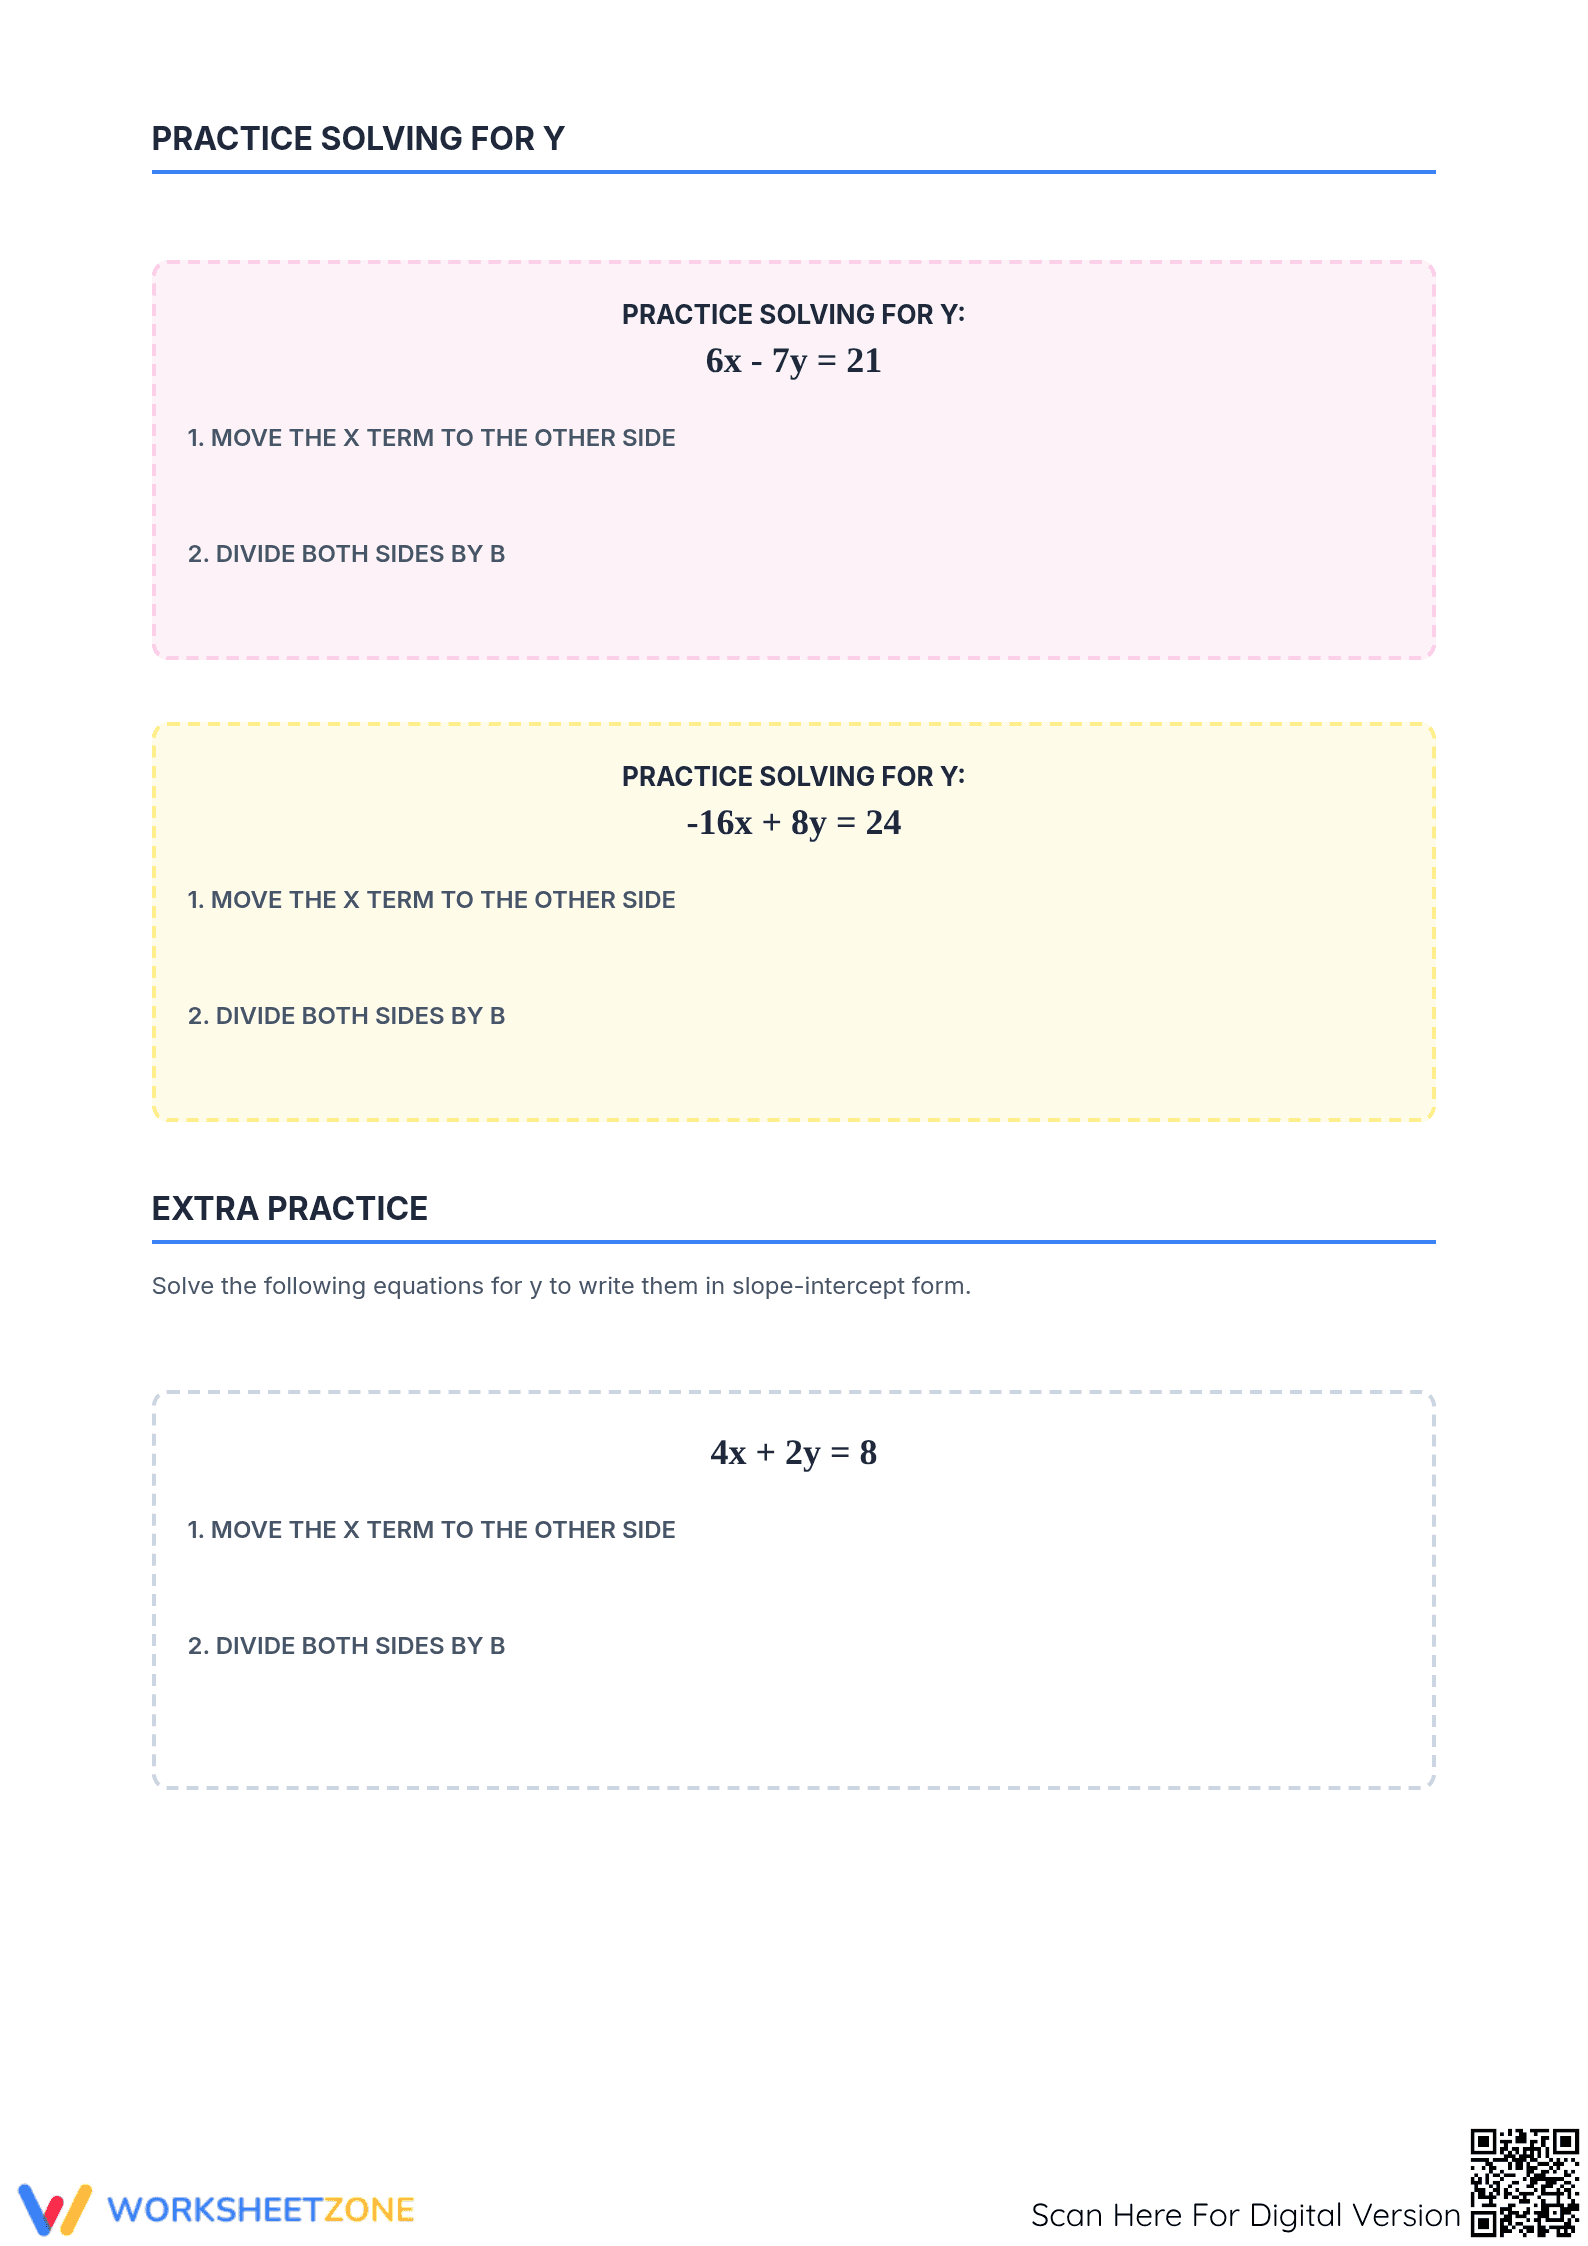
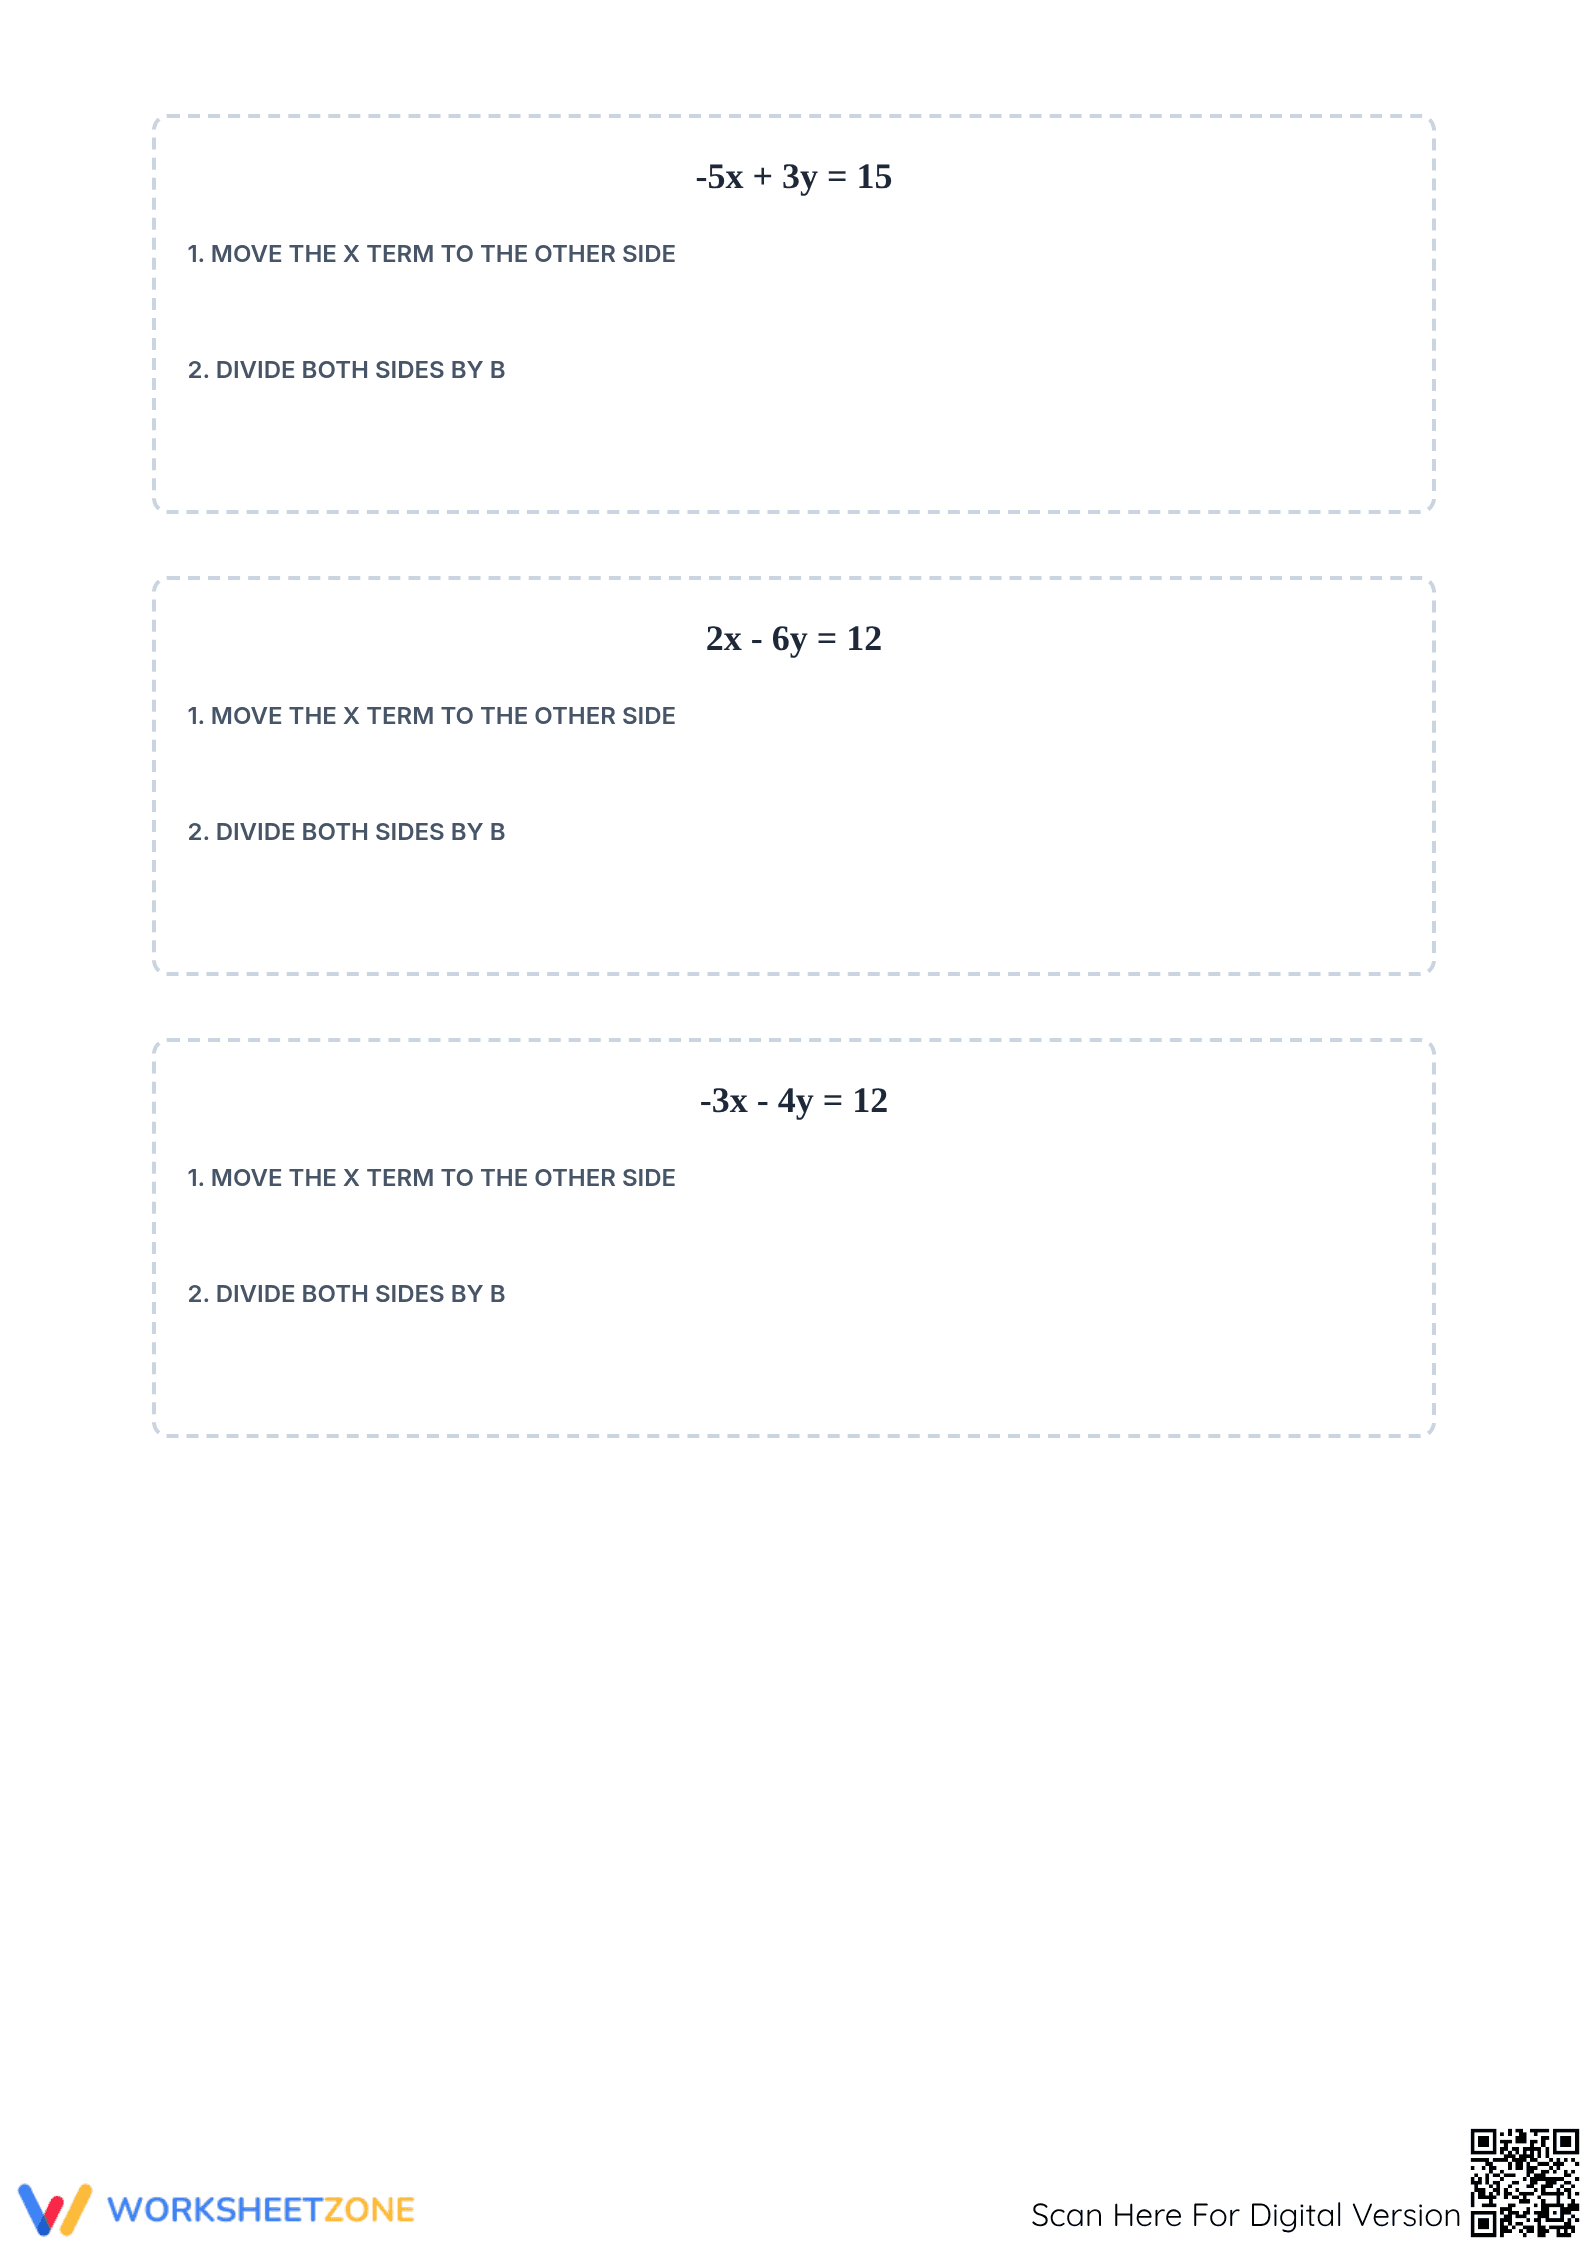
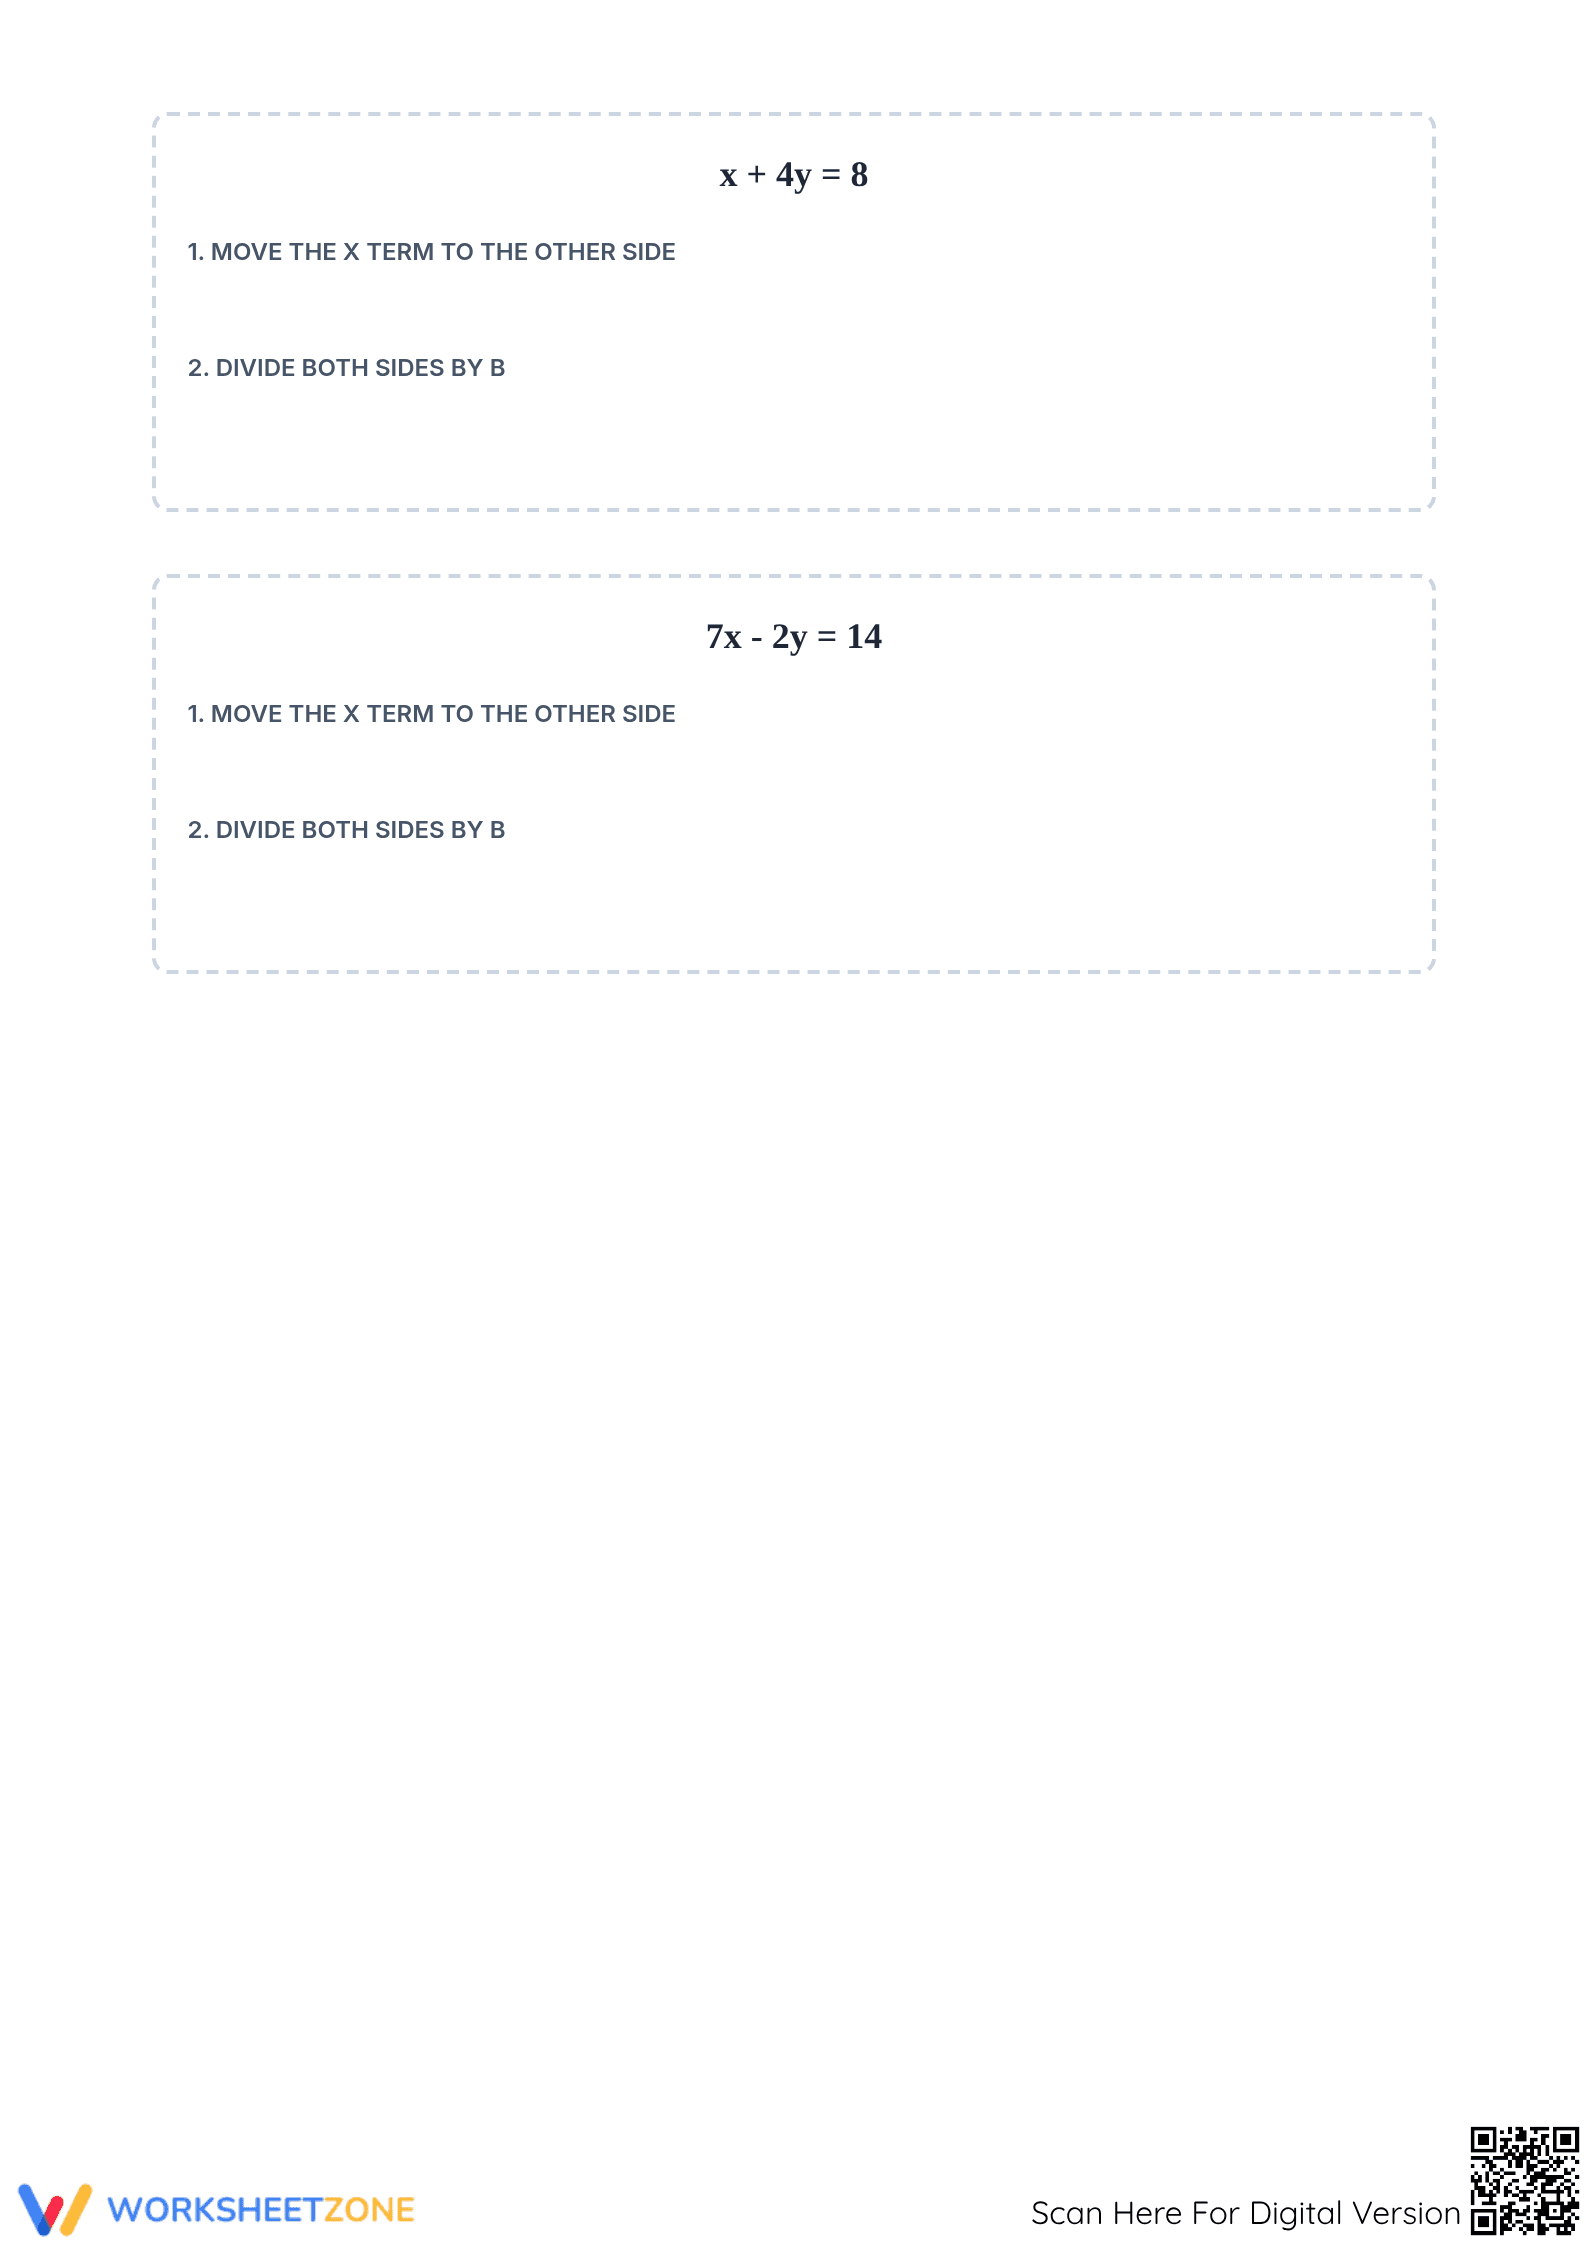
This worksheet provides targeted practice for high school students learning to graph linear equations from standard form. It includes a notes page with worked examples and two pages of practice problems designed to build procedural fluency. Students will find x- and y-intercepts to accurately plot lines, reinforcing a key concept in algebra.
At a Glance
- Grade: 9 · Subject: Math, Algebra
- Standard:
HSA-REI.D.10— Understand that the graph of an equation in two variables is the set of all its solutions.- Skill Focus: Graphing Linear Equations in Standard Form
- Format: 4 pages · 8 problems · Answer key included · PDF
- Best For: Guided practice, independent work, homework
- Time: 20–35 minutes
What's Inside
This 4-page PDF includes a notes page breaking down how to find intercepts from standard form. Two pages contain 8 practice problems on clear graphs. The final page is a complete answer key with each line plotted for easy review.
Zero-Prep Workflow
This zero-prep resource saves teacher time. The workflow is simple:
- 1. Print (1 min): The 4-page PDF is ready to print.
- 2. Distribute (1 min): Give students the notes and practice pages. They can start immediately.
- 3. Review (5-10 min): Use the answer key to review solutions with the class or for self-checking.
Total prep time is under 2 minutes, making it ideal for sub plans, homework, or review.
Standards Alignment
This worksheet aligns with HSA-REI.D.10, which focuses on understanding that an equation's graph represents all its solutions. The tasks directly support this by having students create graphs from equations. It also builds a foundation for HSF-IF.C.7.a (graphing linear functions). Both standard codes can be copied directly into lesson plans or curriculum maps.
How to Use It
Use this resource for independent practice after a direct instruction lesson. It also serves as a formative assessment; circulate and check if students are correctly calculating the x- and y-intercepts. A common error is mixing them up, offering a key teaching point. The worksheet takes most students 20 to 35 minutes to complete.
Who It's For
This resource is for Algebra 1 students (grades 8-10) learning to graph linear equations. The included notes page provides a helpful scaffold for those who need extra support. It pairs well with a lesson on solving for a variable.
Mastering procedural skills like graphing linear equations is a critical foundation for higher-level mathematics. This worksheet supports HSA-REI.D.10 by providing students with structured practice in translating algebraic representations into graphical ones. Research consistently highlights the importance of procedural fluency built on conceptual understanding. According to Fisher & Frey (2014), effective instruction moves students from guided to independent practice, a model this resource follows with its notes and problem sets. By focusing on finding intercepts from the standard form, this worksheet gives students an efficient strategy for graphing, a core skill for success in algebra and beyond. This approach ensures students not only know the procedure but understand the relationship between an equation and its visual representation on the coordinate plane.