10th grade enzyme printable worksheets give biology teachers a ready-made progression through one of the most conceptually demanding topics in a standard high school life science course — from the lowering of activation energy to the geometry of an active site to the environmental conditions that cause denaturation. Each worksheet targets a discrete piece of that progression, so students build understanding step by step rather than confronting the entire enzyme story at once.
Skills and Concepts Across the Set
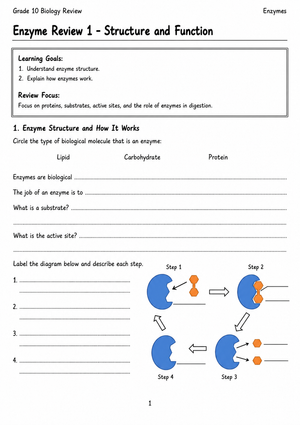
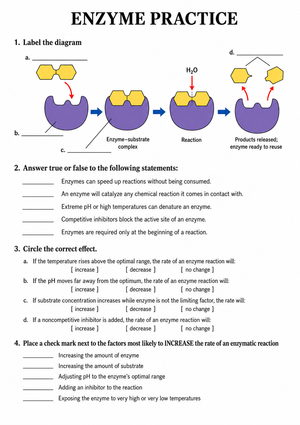
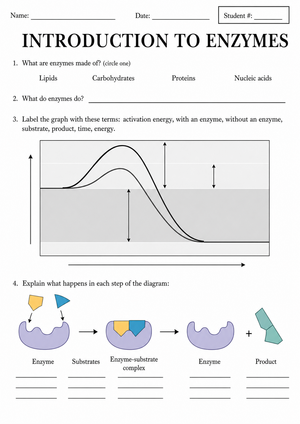
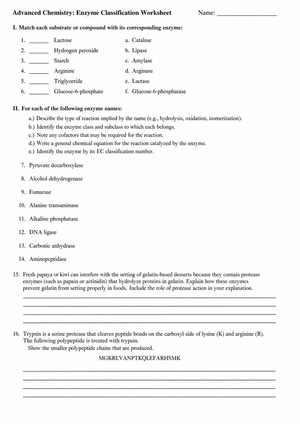
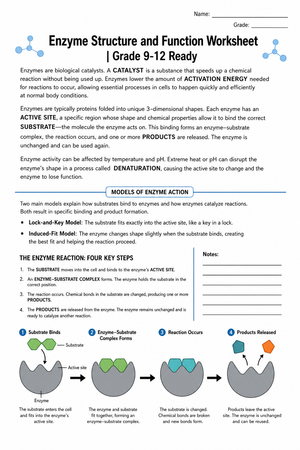
The worksheets move through five major areas. Energy diagrams ask students to trace the reaction pathway with and without a catalyst present, then annotate the difference in activation energy directly on the graph. Vocabulary work — matching, fill-in-the-blank, and short-answer — grounds students in precise terminology: substrate, active site, enzyme-substrate complex, catalyst, reactant, product. Lock-and-key and induced fit worksheets present labeled diagrams for students to interpret and unlabeled diagrams for them to complete, with sequence questions that ask them to trace what happens from initial binding through product release. A separate cluster focuses on factors affecting reaction rate — temperature, pH, and substrate concentration — through raw data tables that students graph and then interpret in writing. Finally, applied worksheets connect enzyme function to the digestive system, asking students to identify salivary amylase's substrate, locate where pepsin operates, and explain why the stomach's acidic environment is not incidental but functionally necessary.
That last group — the digestive system application worksheets — consistently generates the most student engagement. When students recognize that every meal they eat depends on enzymes working within tight pH ranges and temperature windows, the abstract graphing exercises earlier in the unit suddenly carry real weight.
Student Errors Worth Anticipating Before You Distribute These
Enzyme biology produces a reliable cluster of misconceptions. The most common one on lock-and-key diagrams: students correctly draw the enzyme and substrate fitting together, then flip the labels — writing "substrate" on the enzyme molecule and "enzyme" on the substrate. This happens because many diagram versions don't show the enzyme embedded in a membrane or inside a cell, so students have no visual anchor for which molecule is the larger protein. A quick pre-teaching reminder that the enzyme is always the protein — and proteins are the larger molecule — reduces this error significantly before students ever pick up a pencil.
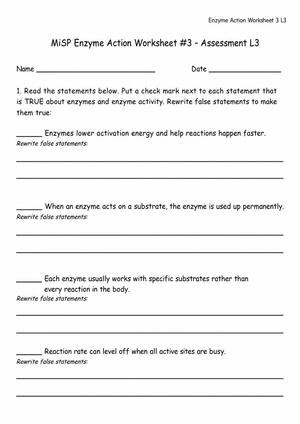
On pH and temperature graphs, students read the bell curve's right-side drop as the enzyme "slowing down" rather than denaturing. They treat denaturation as reversible — "just cool it back down and it'll work again" — which is the opposite of what happens to a permanently unfolded protein. The worksheets that ask students to predict whether activity would recover after cooling or after returning to neutral pH expose this misunderstanding directly. Those prediction questions are the most diagnostically useful items in the set.
A third persistent error shows up in substrate concentration graphs. Students see the leveling-off plateau and assume something went wrong with the data rather than recognizing enzyme saturation. Asking students to annotate the plateau with a written explanation — in their own words, not a definition copied from notes — separates students who understand the concept from students who memorized the phrase "all active sites are occupied."
Fitting These Worksheets Into Your Lesson Sequence
These resources work well as pre-lab preparation before a catalase or liver enzyme lab. Before students handle hydrogen peroxide, a worksheet reviewing the catalase reaction — substrate, product, enzyme source — ensures they understand the chemistry they're observing rather than just following steps. After the lab, an extension worksheet asking students to explain what would happen to reaction rate if the liver sample were boiled first gives the denaturation concept an immediate, testable context tied directly to what they just observed.
Within a standard class period, the graphing worksheets fit cleanly into the first 20 minutes. Students receive a data table, construct the graph, and identify the optimum point — then the remaining time shifts to discussion of what happens at the extremes. The vocabulary and diagram worksheets work well as opening warm-ups at the start of a unit or as brief review the morning before an assessment. Used that way, they distribute practice across the week rather than cramming all enzyme review into a single block.
The 10th grade enzyme printable worksheets also work as asynchronous assignments for students who miss lab days, giving them a paper-based data analysis task that mirrors what their classmates worked through experimentally.
Standard Alignment
These worksheets align with NGSS HS-LS1-1, which requires students to construct an explanation based on evidence for how the structure of proteins carries out the essential functions of life through systems of specialized cells. Enzyme specificity — the idea that a protein's three-dimensional shape determines which substrates it can bind — is the direct application of that structural logic at the molecular level. The data graphing and interpretation worksheets also support the NGSS Science and Engineering Practice of analyzing and interpreting data, a practice strand that appears consistently on state end-of-course biology assessments. Placing these worksheets early in an enzyme unit means students arrive at formal assessment having already practiced the graph-reading and annotation moves the tests require.
Adjusting the Set for Mixed-Ability Biology Classes
For students who struggle with the graphing components, removing the axis labels from the template and asking them to construct those first — before plotting any data — gives students ownership of the graph structure. Students who freeze when handed a blank grid with raw data often do better when the task is broken into "set up your axes, then plot" rather than presented as a single open-ended step. Pairing those students with a completed axis example from a previous unit also reduces the cognitive load enough that they can focus on the enzyme data itself.
On the other end, students who grasp enzyme mechanics quickly benefit from extension questions that move beyond identification. Ask them to design a hypothetical enzyme inhibitor, predict how a genetic mutation affecting active site shape would change substrate binding, or explain the evolutionary advantage of enzyme specificity over general chemical reactants. The 10th grade enzyme printable worksheets in this set include both foundational diagram work and extension prompts, so the same lesson can serve students at different levels without requiring the teacher to build entirely separate materials.
Frequently Asked Questions
Do these worksheets require prior chemistry knowledge?
Students benefit from a basic understanding of pH as a scale and proteins as a molecule type, both typically covered in 9th grade science. The worksheets don't assume any organic chemistry background, but a quick class review of what pH measures — and why acids and bases affect molecular shape — makes the denaturation activities land more cleanly. Five minutes of review at the start of that lesson is enough.
Can the graphing worksheets substitute for a live enzyme lab?
They serve a different and complementary function. The graphing worksheets build data interpretation skill — reading axes, identifying optima, annotating trends in writing. A live catalase lab builds observational skill and shows students that enzyme activity is a physical, visible event with measurable rates. Both matter. The worksheets explicitly prepare students to make better sense of what they observe in the lab rather than replacing that experience.
How long does a typical worksheet take to complete during class?
Most diagram and vocabulary worksheets run 10–15 minutes when students work independently. The graphing worksheets — particularly those requiring students to construct a graph from a raw data table and then answer interpretation questions — run closer to 20–25 minutes. Factor that into planning if you intend to use those as in-class work rather than homework assignments. The prediction and annotation questions at the end of the graphing worksheets are the slowest part; students need time to write, not just circle an answer.
Are these resources appropriate for an AP Biology class?
The foundational worksheets — lock-and-key diagrams, basic denaturation graphs, vocabulary matching — serve as review at the AP level rather than new instruction. The extension items, particularly those on inhibitor mechanisms and saturation kinetics, align more closely with AP content expectations. Teachers often use the 10th grade enzyme printable worksheets in an AP context for early-unit review while assigning the extension prompts as the primary analytical work.