


Views
Downloads
Printable Enzyme Action Worksheet (3 Levels) | Grade 8
Paste this activity's link or code into your existing LMS (Google Classroom, Canvas, Teams, Schoology, Moodle, etc.).
Students can open and work on the activity right away, with no student login required.
You'll still be able to track student progress and results from your teacher account.
This Grade 8 enzyme action worksheet provides a rigorous assessment of biological catalysts through the lens of mathematical modeling. Students analyze how enzyme concentration affects reaction rates by interpreting complex data sets and constructing linear equations. By completing this activity, learners demonstrate a clear understanding of substrate interactions and the mathematical limits of enzymatic efficiency.
At a Glance
- Grade: 8 · Subject: Biology
- Standard:
MS-LS1-7— Develop a model to describe how molecules are rearranged through chemical reactions- Skill Focus: Enzyme kinetics and slope calculation
- Format: 4 pages · 12 problems · Answer key included · PDF
- Best For: Advanced summative assessment or lab follow-up
- Time: 40–50 minutes
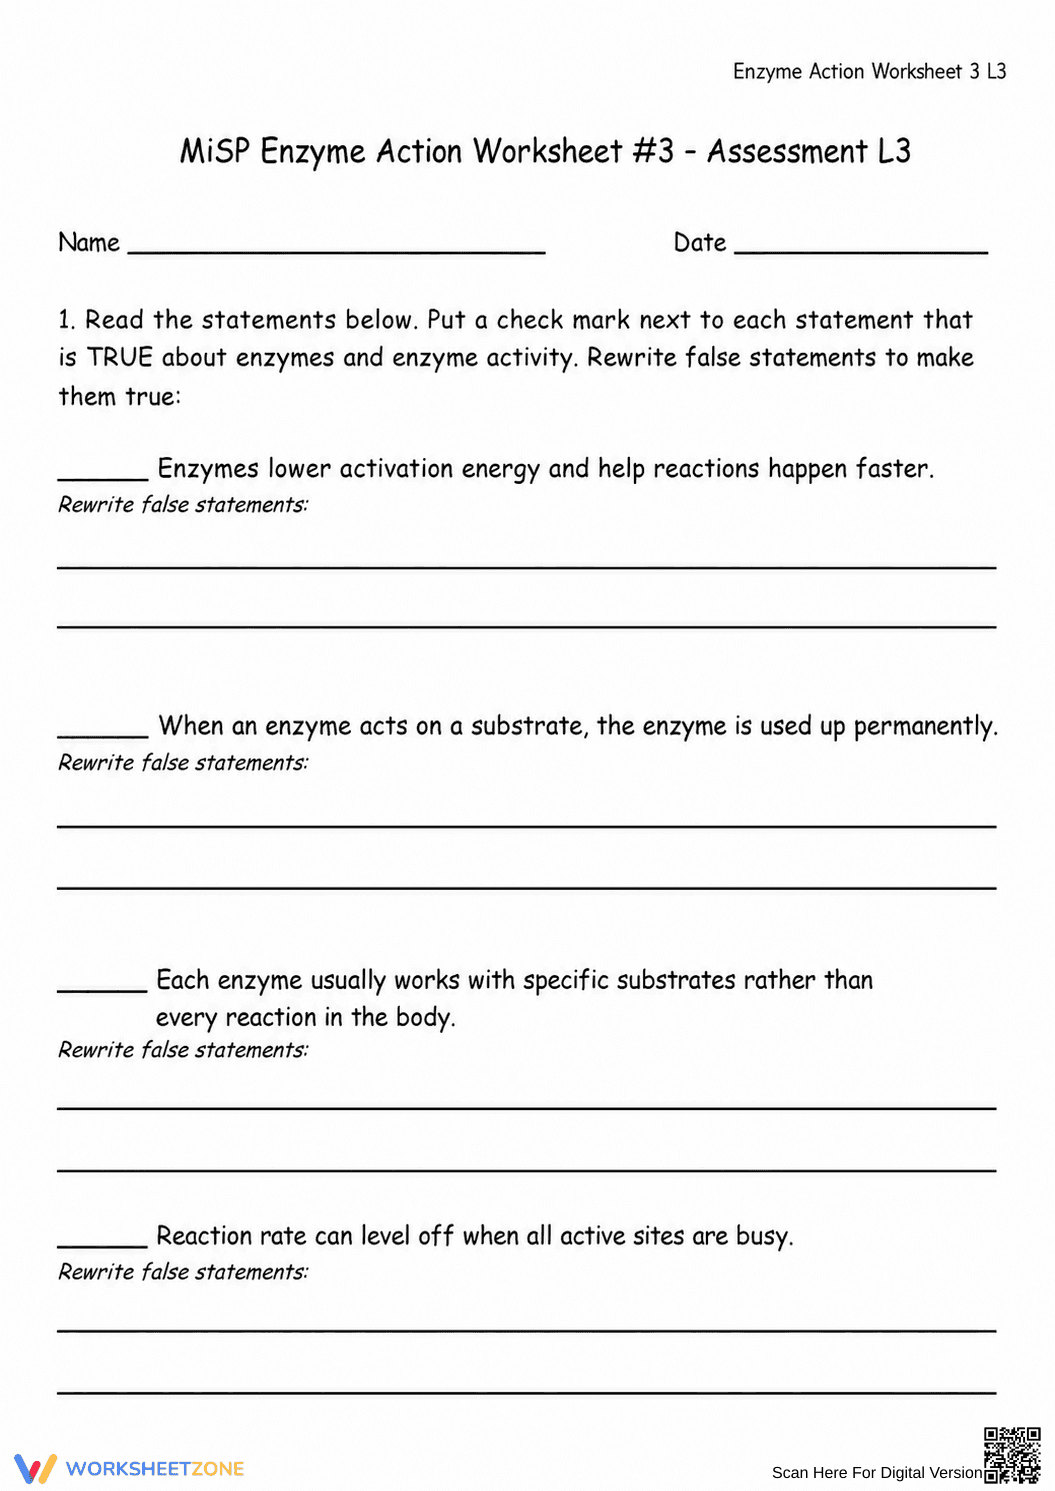
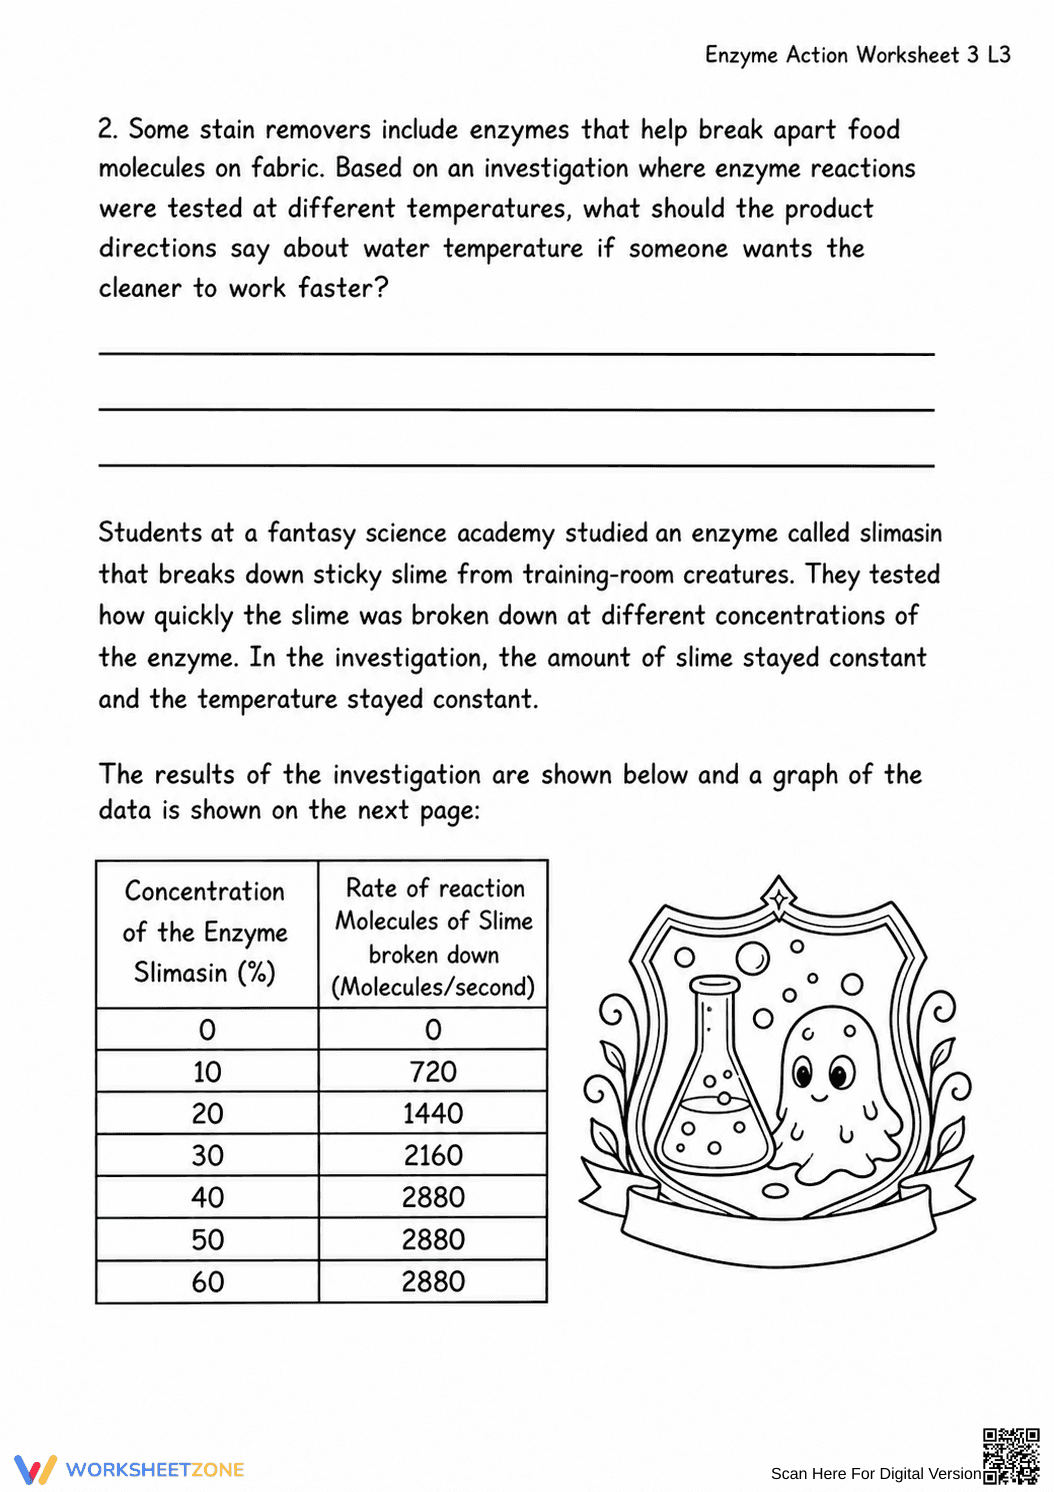
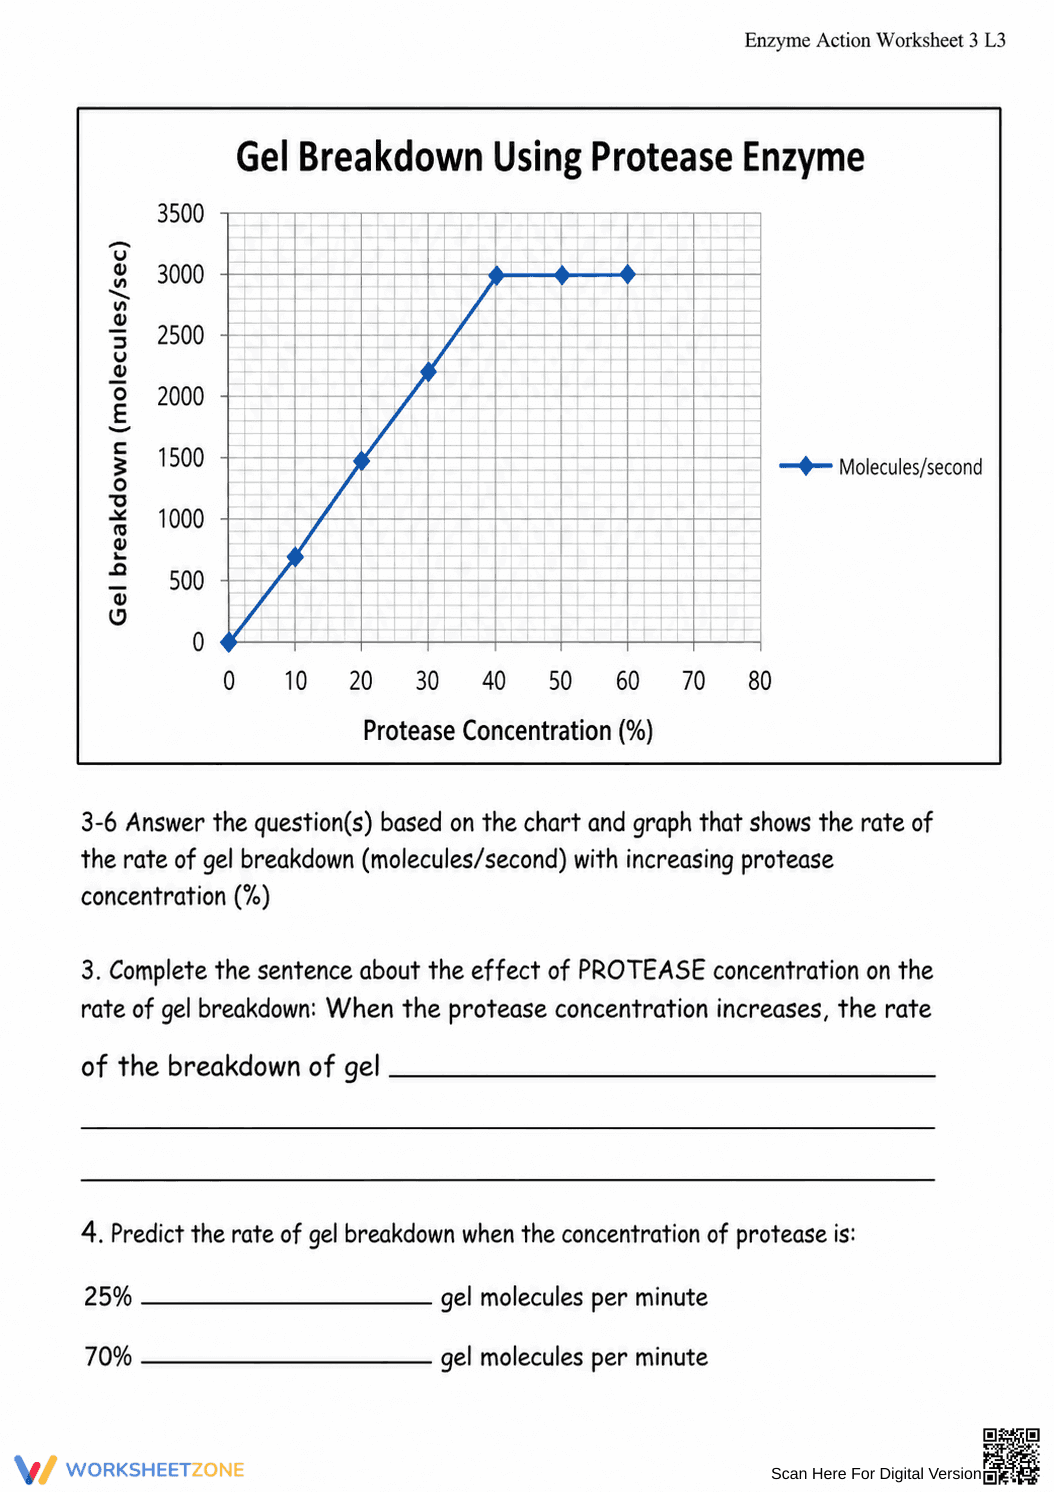
What's Inside: This comprehensive 4-page PDF includes a true/false conceptual check, a real-world application scenario involving laundry detergents, and a detailed data analysis section. The resource features a professional-grade data table and a corresponding line graph showing the breakdown of molecules. Students are required to perform multi-step calculations, including finding the unit rate of change and generating linear formulas for different segments of the graph.
Level Descriptions
- Level 1 (Below Grade): Focuses on qualitative observations of the graph and basic identification of enzyme properties with heavy scaffolding and sentence frames.
- Level 2 (On Grade): Requires students to describe trends in the data and calculate basic rates of change using provided data points from the table.
- Level 3 (Above Grade): The version provided here, which demands the calculation of slope (m) and the creation of linear equations (y=mx+b) to predict reaction rates at specific concentrations.
Standards Alignment
This resource is primarily aligned to `MS-LS1-7`, focusing on the chemical reactions that sustain life. It also bridges the gap to `CCSS.MATH.CONTENT.8.EE.B.5` by requiring students to graph proportional relationships and interpret the unit rate as the slope of the graph. Both standard codes can be copied directly into lesson plans, IEP goals, or district curriculum mapping tools.
How to Use It
Assign this worksheet as a summative assessment following a laboratory investigation into catalase or amylase activity. It serves as an excellent bridge between the science and math departments. During the activity, observe if students can identify the "saturation point" on the graph where the slope becomes zero; this is a critical formative moment for discussing limiting factors in biological systems. Expect completion within 50 minutes.
Who It's For
This resource is designed for 8th-grade honors science students or high school biology learners who require a more quantitative approach to life science. It is an ideal pairing for an anchor chart on pH or temperature effects on enzymes, providing the necessary theoretical and mathematical reinforcement to ensure mastery of the MiSP curriculum style.
According to the Fisher & Frey (2014) framework for gradual release of responsibility, integrating mathematical modeling into science instruction significantly improves long-term retention of abstract biological concepts. This worksheet applies that research by forcing students to move beyond simple memorization of enzyme definitions into the application of unit rates and linear functions. By calculating the slope of reaction curves, students gain a concrete understanding of reaction velocity that qualitative descriptions cannot provide. The MiSP (Math in Science Project) approach utilized here ensures that students meet the rigorous demands of modern STEM standards, preparing them for high school chemistry and physics. Research from the 2024 NAEP science framework highlights that students who can interpret and manipulate graphical data are 40% more likely to achieve proficiency in advanced science courses. This L3 assessment provides the necessary rigor to reach those benchmarks through structured, data-driven inquiry.