


1 / 2
0
Views
0
Plays

0.0
0
Save
0 Likes
Dot Plots and Histograms
0 Views
0 Plays
Paste this activity's link or code into your existing LMS (Google Classroom, Canvas, Teams, Schoology, Moodle, etc.).
Students can open and work on the activity right away, with no student login required.
You'll still be able to track student progress and results from your teacher account.
Information
Description
What It Is:
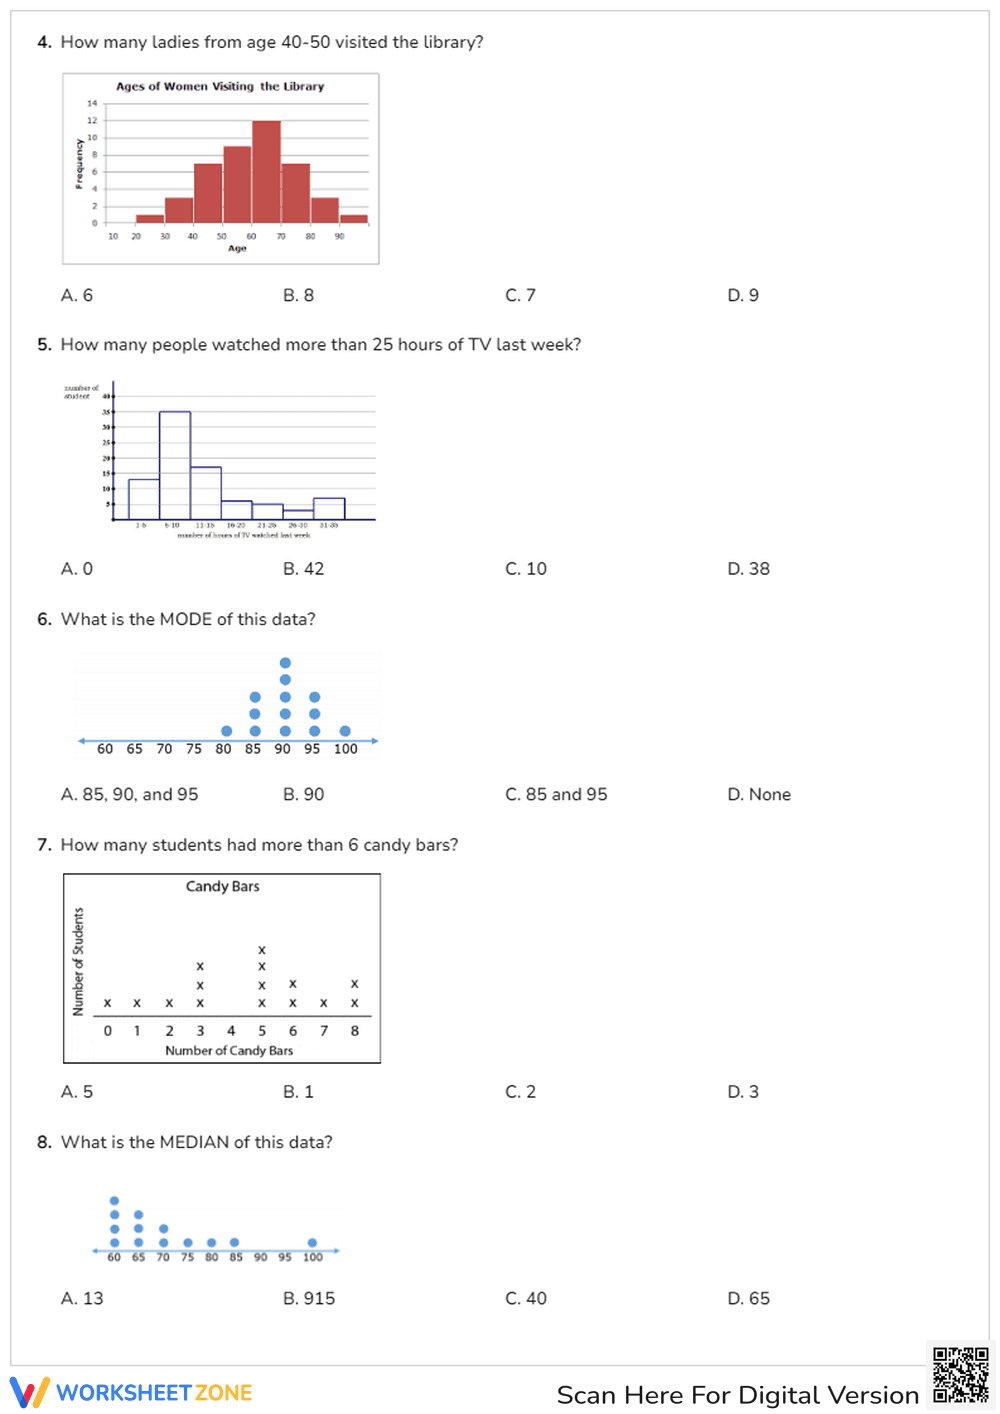
A math worksheet with multiple-choice questions that ask students to interpret data from graphs, histograms, bar charts, and pictographs.
Why Use It:
This worksheet helps students build data analysis skills, understand graphical representations, and draw conclusions from real-world data.
How to Use It:
• Study each graph or chart carefully
• Analyze the data shown
• Answer multiple-choice questions based on the information
• Practice interpreting different types of graphs
Grade Suitability:
Best suited for upper elementary learners.
• Grade 6 students learning data interpretation
• Grade 7 students strengthening graph analysis skills
Target Users:
Teachers, parents, and homeschoolers teaching data handling and statistics.