


Views
Downloads
Fruit Bar Graph Worksheet | Grade 1 Essential Practice
Paste this activity's link or code into your existing LMS (Google Classroom, Canvas, Teams, Schoology, Moodle, etc.).
Students can open and work on the activity right away, with no student login required.
You'll still be able to track student progress and results from your teacher account.
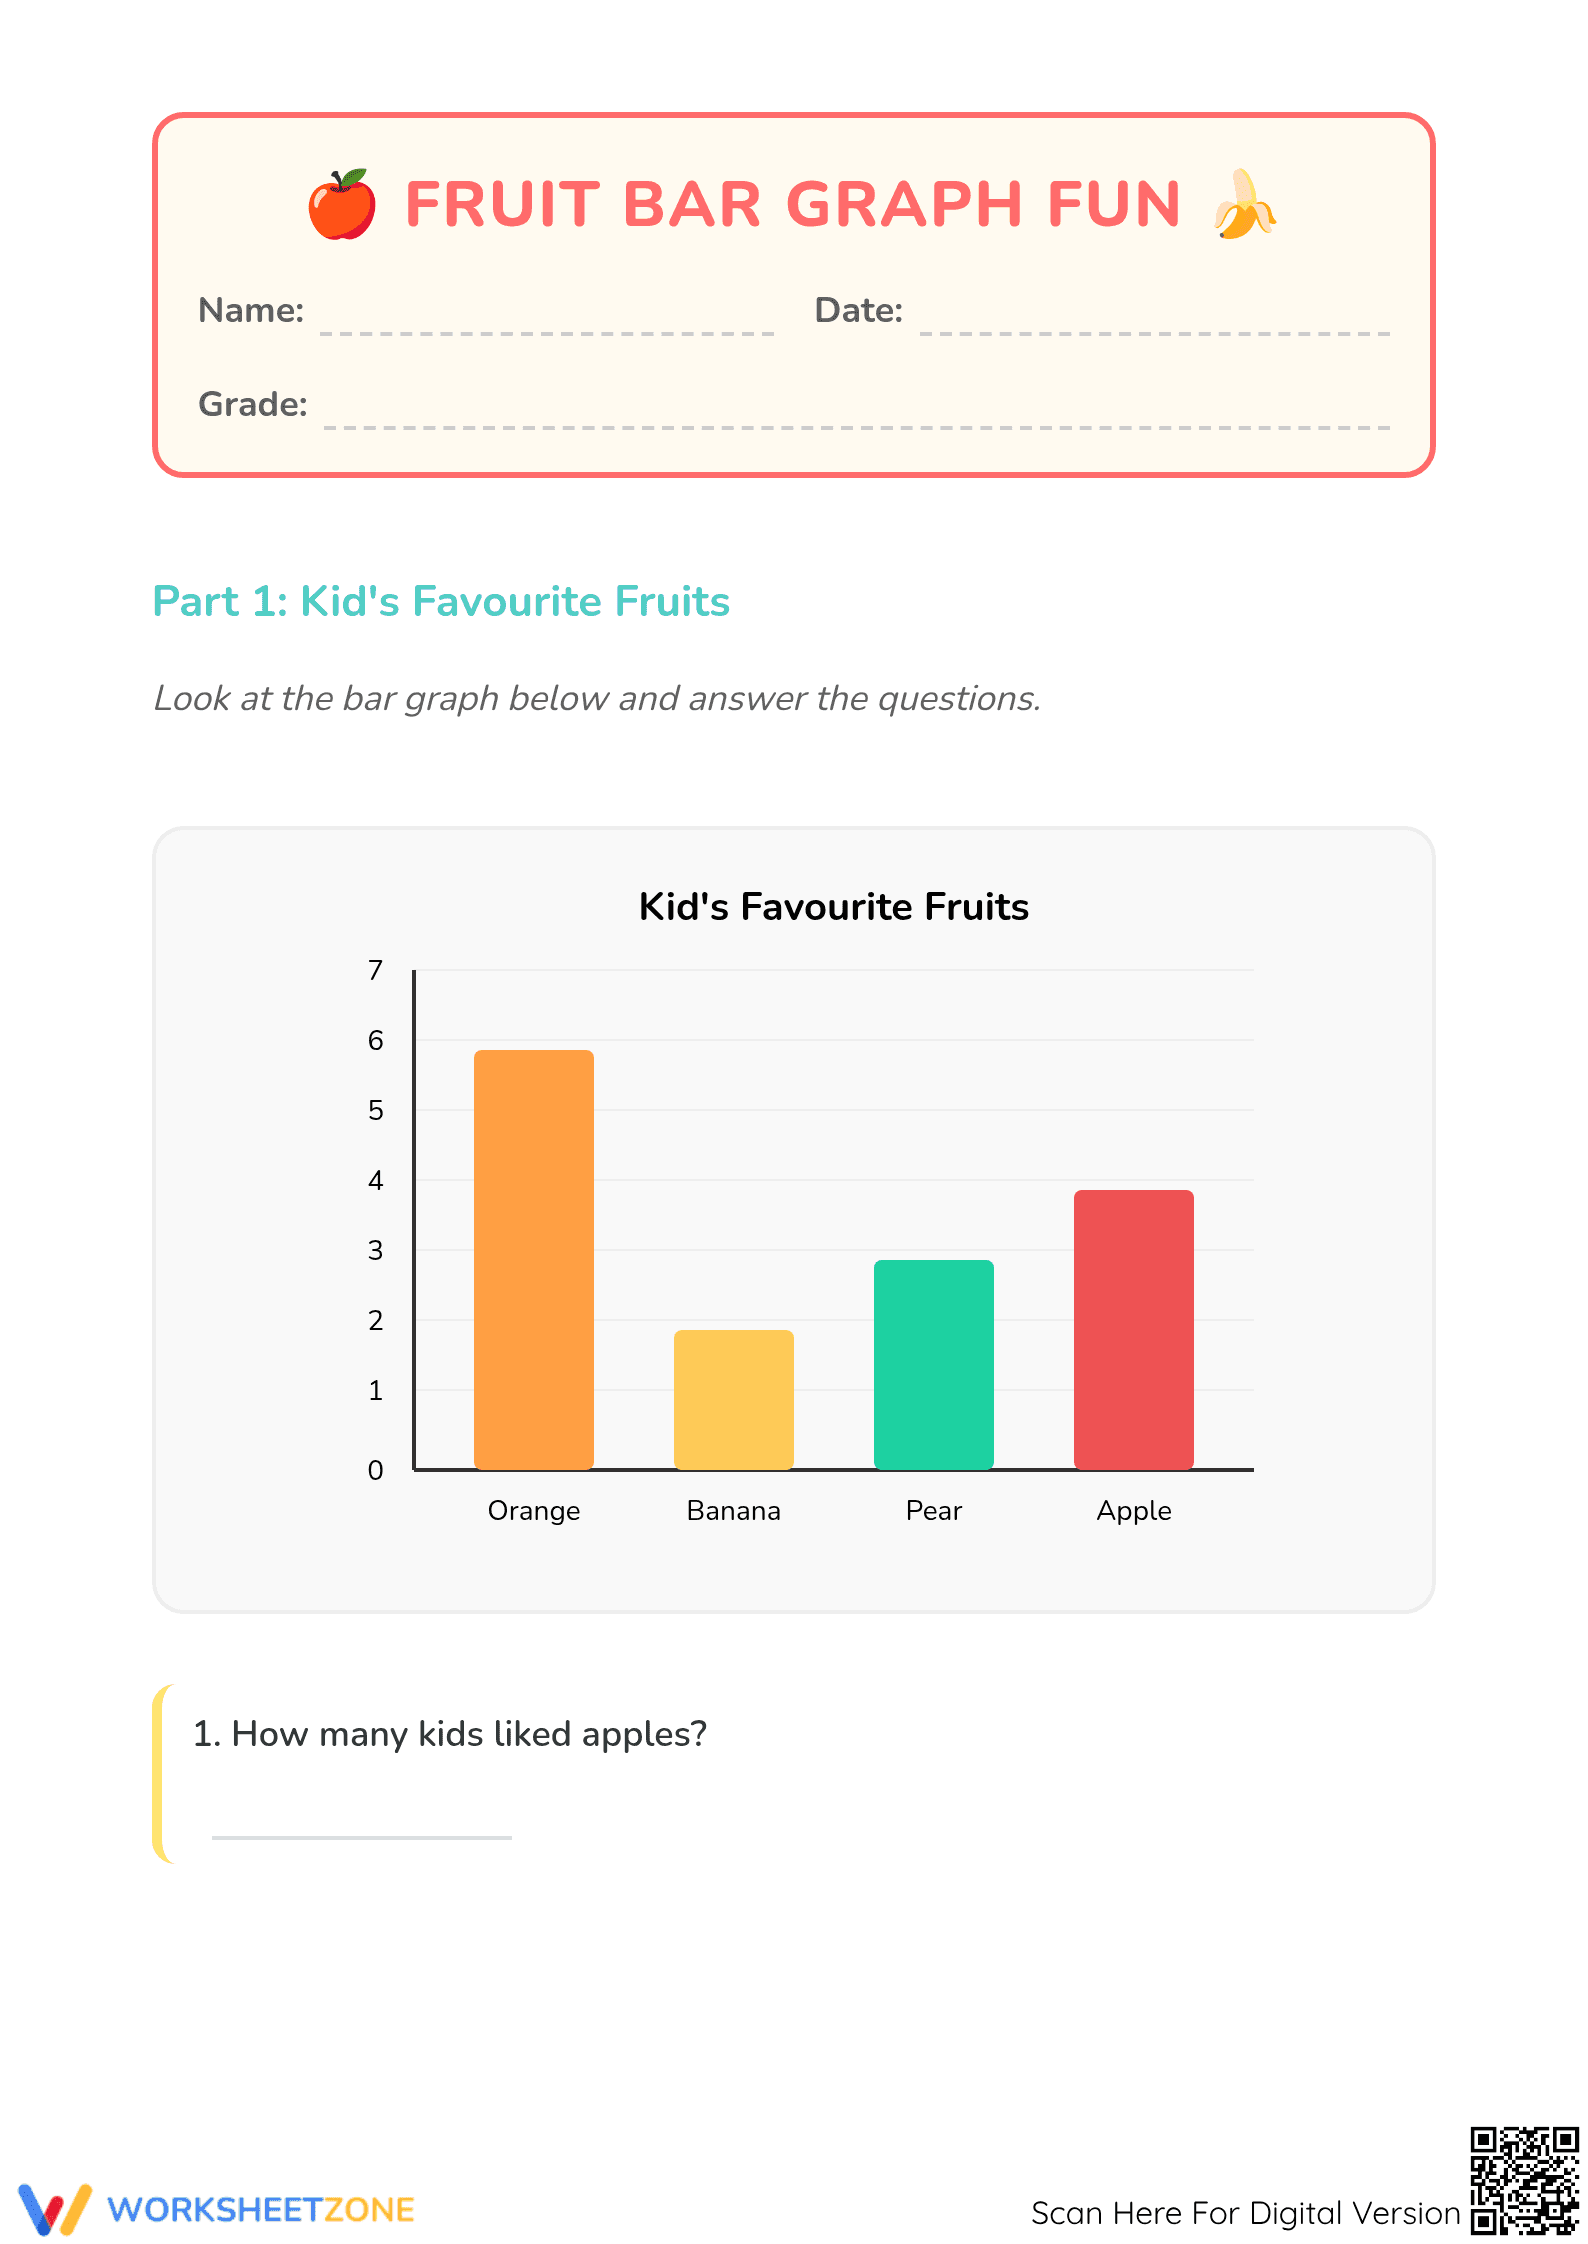
This Grade 1 graphing worksheet helps students master data interpretation through a relatable "Kid's Favourite Fruits" theme. Students analyze a colorful bar graph to identify quantities, compare categories, and calculate totals. By engaging with visual data, learners build the foundational logic required for more complex mathematical reasoning and statistical literacy in later grades.
At a Glance
- Grade: 1 · Subject: Math
- Standard:
CCSS.MATH.CONTENT.1.MD.C.4— Organize, represent, and interpret data with up to three categories- Skill Focus: Bar Graph Interpretation
- Format: 2 pages · 8 problems · Answer key included · PDF
- Best For: Independent practice or formative assessment
- Time: 15–20 minutes
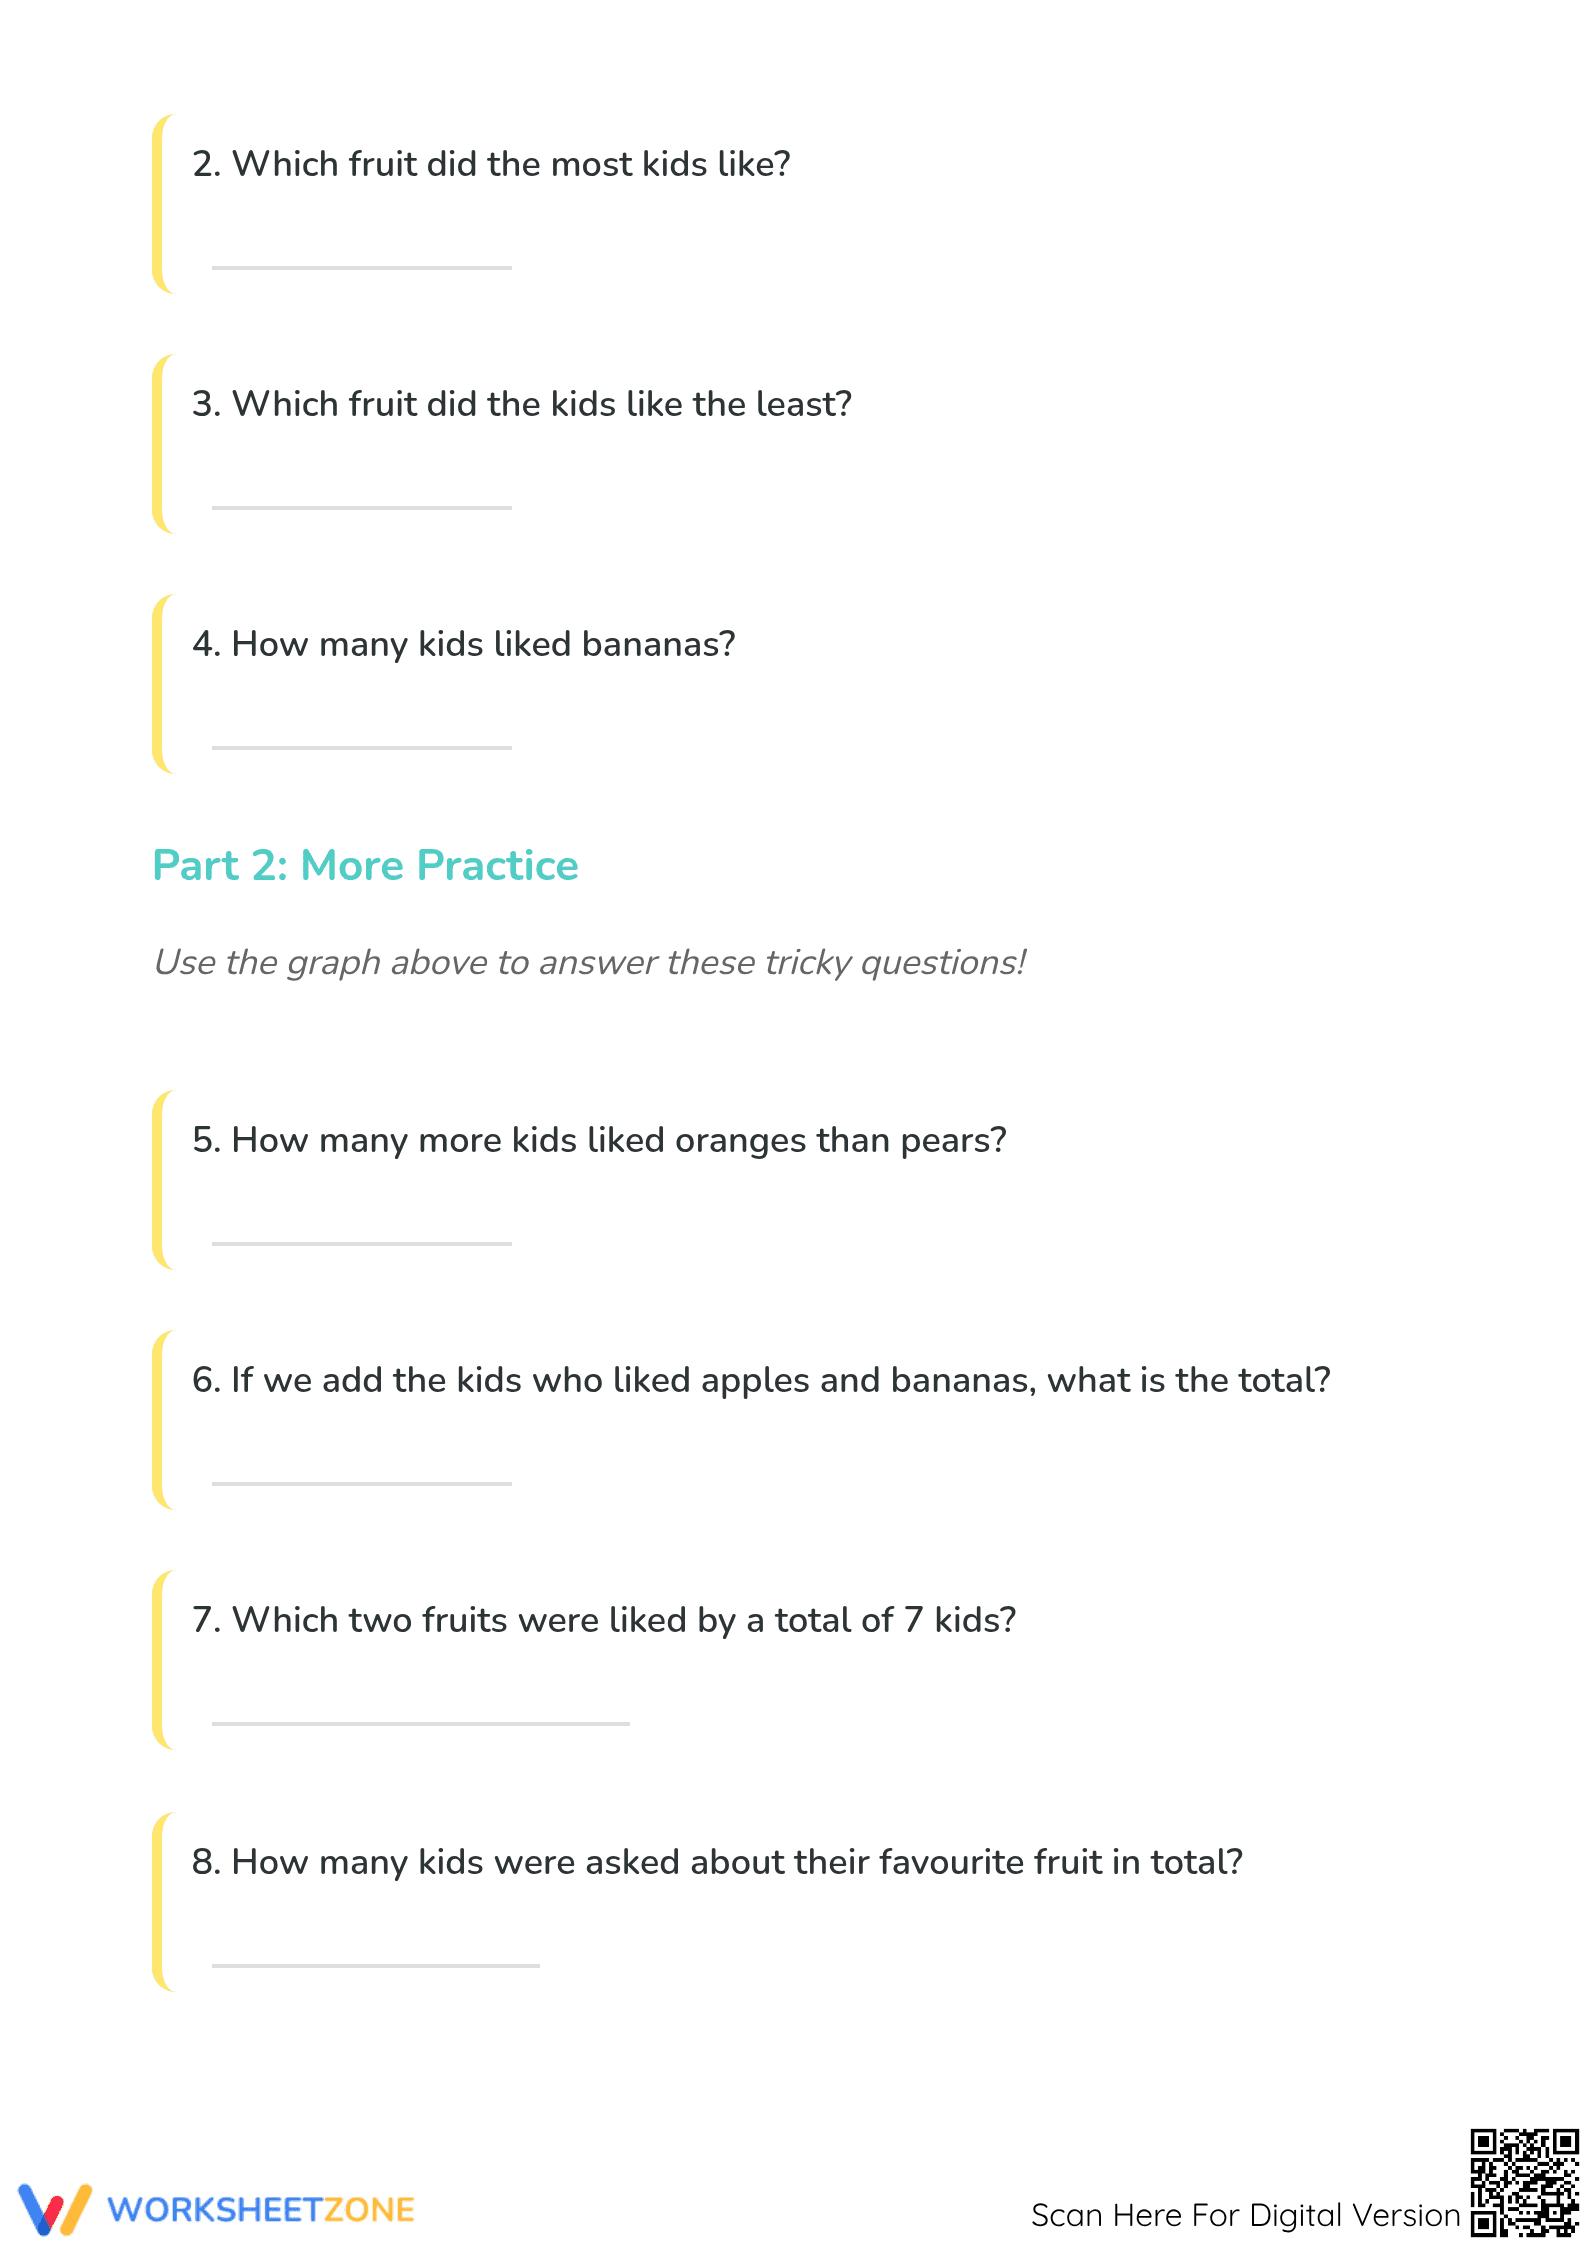
What's Inside: This 2-page PDF features a clear, high-contrast bar graph representing four fruit categories: Orange, Banana, Pear, and Apple. The first page contains four introductory questions focusing on direct retrieval, such as identifying the most and least popular items. The second page introduces "More Practice" with four advanced questions requiring addition and subtraction to compare data points and find the grand total.
Zero-Prep Workflow: This resource is designed for immediate classroom implementation. First, print the 2-page document for your class (30 seconds). Second, distribute the sheets during your math block; the self-explanatory layout requires minimal teacher introduction (1 minute). Finally, use the included answer key to review student work or allow for self-correction at a math center (30 seconds). Total prep time is under 2 minutes.
Standards Alignment: The primary focus is `CCSS.MATH.CONTENT.1.MD.C.4`, which requires students to organize, represent, and interpret data with up to three categories; ask and answer questions about the total number of data points, how many in each category, and how many more or less are in one category than in another. While this sheet uses four categories, it perfectly mirrors the cognitive demands of the standard. Both standard codes can be copied directly into lesson plans, IEP goals, or district curriculum mapping tools.
How to Use It: Use this worksheet as a "Check for Understanding" after a direct instruction lesson on how to read a Y-axis. Alternatively, assign it as a morning work activity to reinforce data literacy. During the activity, observe if students are using their fingers to track from the top of the bar to the corresponding number on the scale. Completion typically takes 15 to 20 minutes.
Who It's For: This resource is ideal for first-grade students or advanced kindergarteners ready for numerical data. It provides excellent support for English Language Learners (ELLs) through visual representations of fruit. It pairs naturally with a physical classroom survey where students create their own human bar graph before transitioning to this paper-based practice.
Research from Fisher & Frey (2014) emphasizes the importance of the gradual release of responsibility, which this worksheet supports through its two-part structure. By first asking students to identify simple values before moving to comparative "how many more" questions, the resource scaffolds the cognitive load. According to the NAEP data analysis framework, early exposure to interpreting categorical data is a significant predictor of later success in algebraic thinking. This worksheet specifically targets `CCSS.MATH.CONTENT.1.MD.C.4`, ensuring students can accurately translate visual bar heights into numerical values. The inclusion of 8 distinct tasks provides sufficient repetition to solidify the concept of a scale. Educators can rely on this structured approach to bridge the gap between concrete counting and abstract data representation. This printable PDF serves as a reliable tool for documenting student progress toward mastery in foundational statistics and probability.