


Views
Downloads
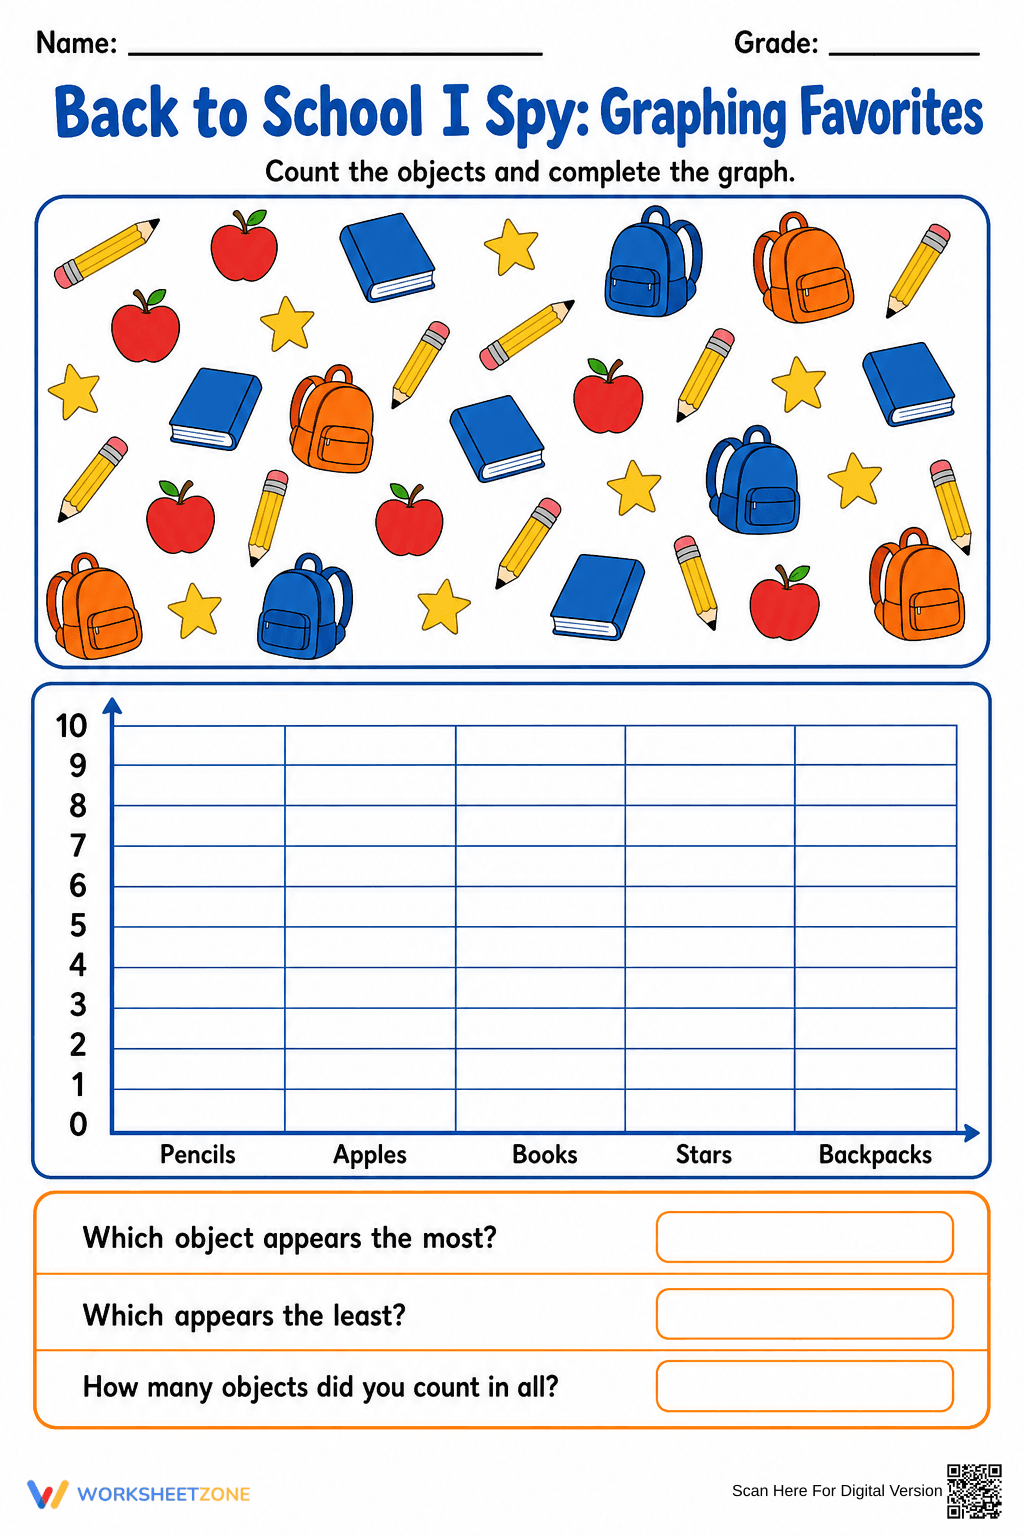
Grade 1 Back to School I Spy — Printable Graphing Worksheet
Paste this activity's link or code into your existing LMS (Google Classroom, Canvas, Teams, Schoology, Moodle, etc.).
Students can open and work on the activity right away, with no student login required.
You'll still be able to track student progress and results from your teacher account.
This Grade 1 graphing worksheet helps students master data organization through an engaging school-themed search scene. Students count five distinct object types and translate those totals into a visual bar graph. By interpreting their own data to answer comparative questions, learners build the foundational logic required for higher-level statistical analysis and mathematical reasoning.
At a Glance
- Grade: 1 · Subject: Math
- Standard:
CCSS.MATH.CONTENT.1.MD.C.4— Organize, represent, and interpret data with up to three categories- Skill Focus: Bar Graphing & Data Analysis
- Format: 1 page · 9 tasks · Answer key included · PDF
- Best For: Morning work or math centers
- Time: 15–20 minutes
The worksheet features a high-density "I Spy" scene containing pencils, apples, books, stars, and backpacks. Below the scene, a structured bar graph grid with a y-axis scaled from 0 to 10 provides the framework for data representation. The final section includes three targeted comprehension questions focusing on maximums, minimums, and total sums. This single-page PDF is designed with high-contrast borders and clear labels to support independent student work.
The zero-prep workflow is designed for maximum teacher efficiency. First, print the single-page PDF (30 seconds). Second, distribute the sheets to students as they enter the classroom or transition to math centers (1 minute). Third, review the completed graphs and analysis questions as a whole group to provide immediate feedback (5 minutes). This resource is an ideal grab-and-go option for unexpected sub plans or rainy-day schedules.
This resource aligns primarily with `CCSS.MATH.CONTENT.1.MD.C.4`, which requires students to organize, represent, and interpret data with multiple categories. It specifically addresses the requirement to ask and answer questions about the total number of data points and comparisons between categories. Both standard codes can be copied directly into lesson plans, IEP goals, or district curriculum mapping tools.
Use this worksheet during the independent practice phase of a lesson on data. After demonstrating how to tally objects on the board, assign this sheet for individual work. It also serves as an effective formative assessment; observe students as they count to see if they use strategies like crossing off items to ensure accuracy. Completion typically takes 15 to 20 minutes depending on the student's counting speed.
This activity is tailored for first-grade students but serves as an excellent review for second graders or a challenge for advanced kindergarteners. It is particularly helpful for English Language Learners (ELLs) due to the heavy visual support and clear object labels. Pair this with a physical sorting activity using classroom manipulatives to reinforce the transition from concrete to representational math.
Effective data literacy instruction in early elementary grades relies on the transition from concrete counting to abstract representation. According to Fisher & Frey (2014), providing students with structured scaffolds—such as the pre-labeled axes and visual search scenes found in this worksheet—facilitates the gradual release of responsibility. This resource targets CCSS.MATH.CONTENT.1.MD.C.4 by requiring students to not only count but also synthesize information to determine "most" and "least" attributes. Research from the NAEP indicates that students who engage in regular data interpretation tasks show higher proficiency in logical reasoning by third grade. By integrating 5 distinct categories and 3 specific analysis questions, this worksheet ensures students meet rigorous state standards while maintaining high engagement through a familiar school theme. This evidence-based approach to graphing provides the necessary repetition for mastery in foundational mathematics.