These line plot worksheets give students in grades 2 through 5 structured practice with one of the earliest data tools they encounter in elementary math — reading distributions, plotting values, and pulling meaning from a number line before the data disappears into a bar or pie chart. Each page is built around a specific skill level, so teachers can reach for the right version without hunting through a general collection.
Skills Covered Across the Grade Band
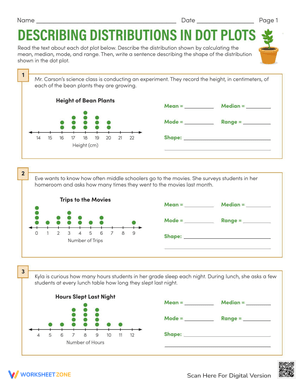
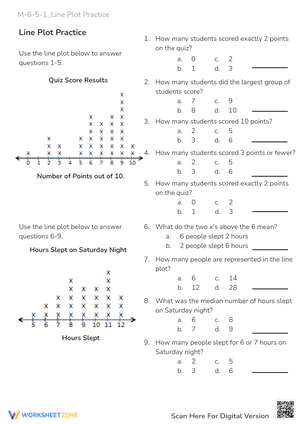
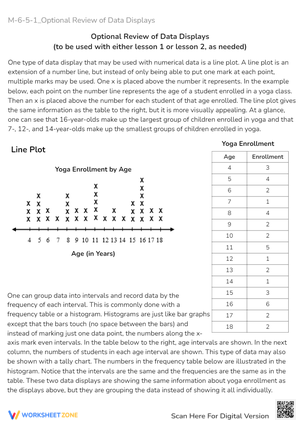
The skills progress deliberately from whole numbers in the primary grades to fractional measurement in the upper elementary years. In grades 2 and 3, students work with small, clean data sets — shoe sizes, letter counts, daily temperatures — plotting whole-number values above a labeled number line and answering questions about the most common value or the spread of the data. The number lines on these pages are already labeled so students can focus on the plotting and interpreting rather than constructing the scale.
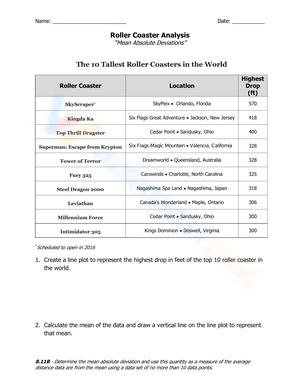
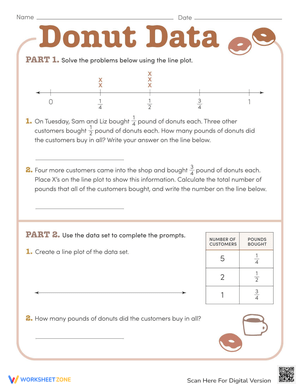
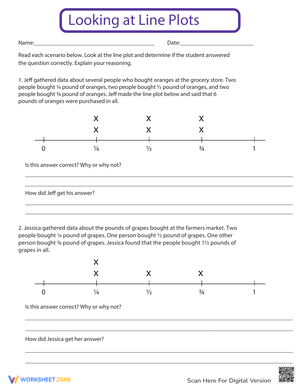
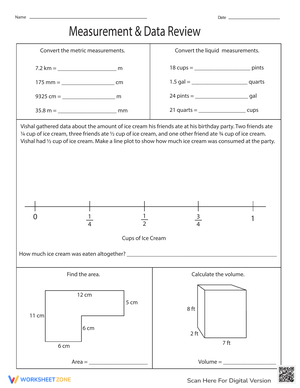
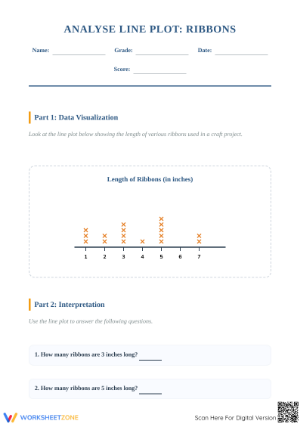
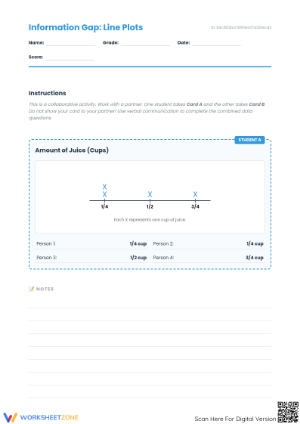
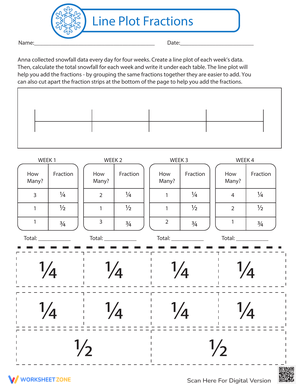
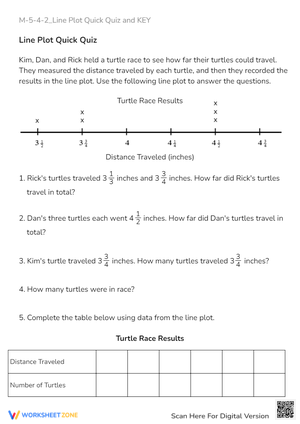
Grades 4 and 5 shift the challenge. Worksheets at these levels use measurement data with fractional values — halves, fourths, and eighths — in contexts like leaf lengths or ribbon cuts. After plotting, students solve addition and subtraction problems using the fractional values shown in the plot, which means the line plot becomes a source of computation rather than just a display. Some pages ask students to find the total of all measurements or determine how much more one group recorded than another, requiring genuine multi-step work.
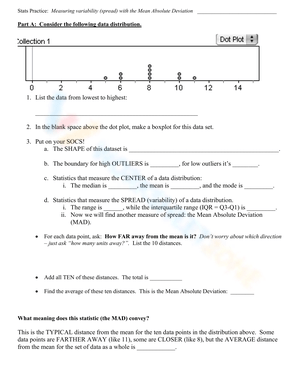
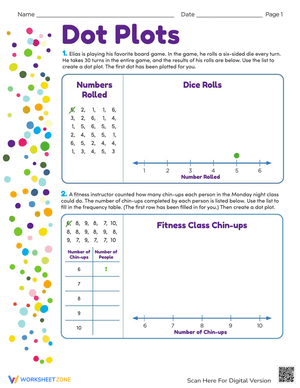
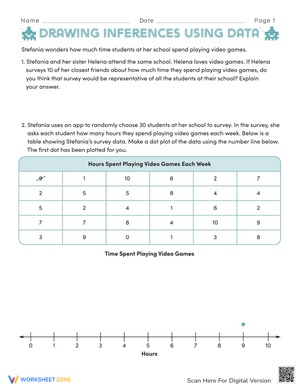
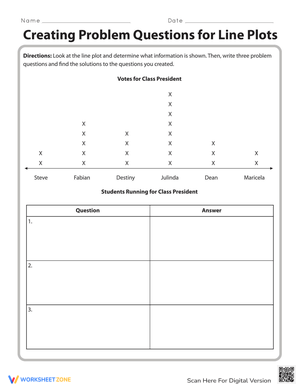
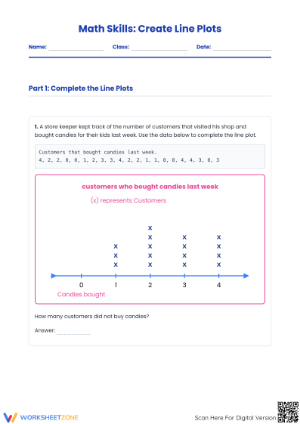
Across all levels, a portion of the worksheets go beyond reading a completed plot. These pages hand students a raw data set and a blank number line and ask them to build the plot themselves — a higher-demand task that surfaces gaps in understanding more clearly than fill-in questions do.
Where These Fit in the Instructional Day
A line plot worksheet works in more slots than just independent practice. During the opening of a lesson, projecting a single page and working through the first question as a class gives students a shared reference point before they split off on their own. The visual is simple enough to annotate live on a board, and the number line structure is familiar enough that even students who are nervous about new content can follow along.
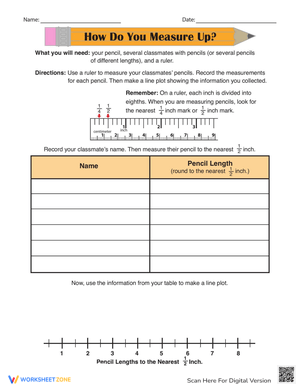
In math centers, these pages pair naturally with a short data-collection moment. If students spend five minutes measuring their pencils to the nearest quarter inch before rotating to the worksheet station, they arrive with data they gathered themselves — and the line plot stops feeling like an abstract exercise. The transition from collector to analyst is exactly the conceptual bridge this skill needs.
For end-of-lesson formative checks, a single line plot question cut from the bottom of a printed page works as a quick exit ticket. One completed plot, one comprehension question, and you have a clear read on who understood the lesson and who will need a different entry point tomorrow. That's a more useful signal than a thumbs-up survey.
The Fraction Jump: Why Grade 4 Is the Pressure Point
Most students handle whole-number line plots without much friction. The number line is familiar, the task is concrete, and counting X's is manageable. The difficulty spike arrives in 4th grade when fractional intervals appear on the scale. Students who have a solid grasp of fractions as quantities can usually transfer that understanding to a number line with some support. Students who still think of fractions primarily as parts of a shape — rather than as points on a line — struggle to place a value like ¾ correctly, often rounding to the nearest whole number without realizing they've done it.
Worksheets for this level work best when the number line is pre-divided and labeled at every interval, removing the scale-construction demand and letting students focus on placement. Once placement is reliable, the computation questions become the main challenge rather than a secondary one on top of a skill students haven't consolidated.
Patterns in Student Work Worth Watching
A few errors appear consistently enough that they're worth anticipating before you hand out a page. The most common: students who can read a completed line plot accurately will still make a systematic error when building one from scratch — they skip values with zero frequency. If the data set has no entries for a particular number, students often leave that point off the number line entirely, compressing the scale and making the distribution unreadable. The fix is quick once you name it, but the error is invisible until you ask students to construct rather than read.
On fraction line plots, a different error surfaces: students plot to the nearest labeled interval rather than the exact fraction, especially when working with eighths. A value of ⅝ lands on ½ or ¾ because those points are easier to see. This isn't carelessness — it reflects a genuine gap in fraction number sense that the plotting task exposes but doesn't automatically correct. Asking students to circle their plotted point and write the fraction beside it slows down the process enough to catch this mid-task.
Standards Placement
Under the Common Core standards, line plots appear at multiple grade levels with increasing demand. 2.MD.D.9 introduces the concept with whole-number measurement data. 3.MD.B.4 continues with whole numbers and adds the expectation that students generate their own measurement data to plot. The significant shift arrives at 4.MD.B.4 and 5.MD.B.2, where fractional data and operations on that data become the core task. This placement is intentional — by 4th grade, students have enough fraction foundation to handle halves and fourths, and the line plot context gives those fractions a spatial representation that reinforces number line thinking across two standards domains at once.
Frequently Asked Questions
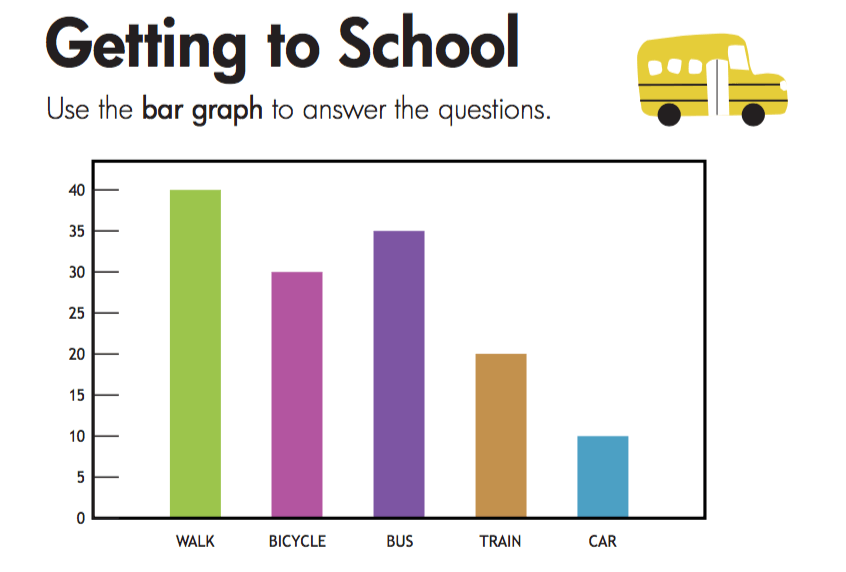
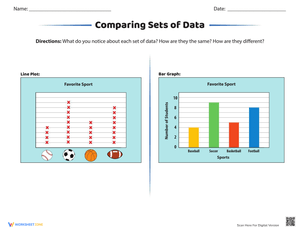
1. How is a line plot different from a bar graph, and which should I teach first?
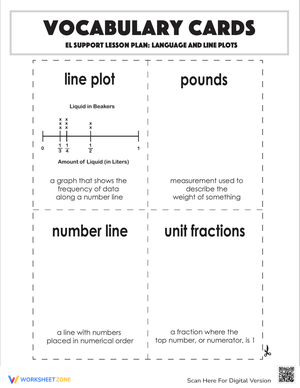
A line plot marks individual data points above a number line, preserving the exact value of each entry. A bar graph aggregates data into categories and uses height to show totals — the individual values disappear into the bar. Line plots are typically introduced first in the elementary sequence because they extend the number line, a tool students have been using since kindergarten. Bar graphs require a separate understanding of scale and category grouping that comes later. When students see a line plot as "data on a number line," the concept clicks faster than introducing it as a new chart type.
2. Can these worksheets work for students who are behind grade level?
A 4th grader working below grade level on fractions can still access the whole-number format and practice the reading and interpreting skills without the fraction demand. Running both versions simultaneously during independent practice — whole-number pages for students who need more time with the structure, fraction pages for students who are ready — keeps the class on the same general concept without requiring a parallel lesson. The skill progression built into this set is meant to support exactly that kind of within-class differentiation.
3. How do I sequence these across a unit rather than using them as one-off pages?
A reliable sequence: start with reading a completed plot and answering comprehension questions, then move to plotting a given data set on a pre-labeled number line, then ask students to construct both the scale and the plot from a raw list of values. Each step adds one layer of demand. Using spaced retrieval — returning to an earlier worksheet format two weeks after initial instruction — helps students hold the skill across the unit rather than learning it once and forgetting it before the assessment.