


Views
Downloads
I Spy: Count and Graph | Essential Grade 1 Math
Paste this activity's link or code into your existing LMS (Google Classroom, Canvas, Teams, Schoology, Moodle, etc.).
Students can open and work on the activity right away, with no student login required.
You'll still be able to track student progress and results from your teacher account.
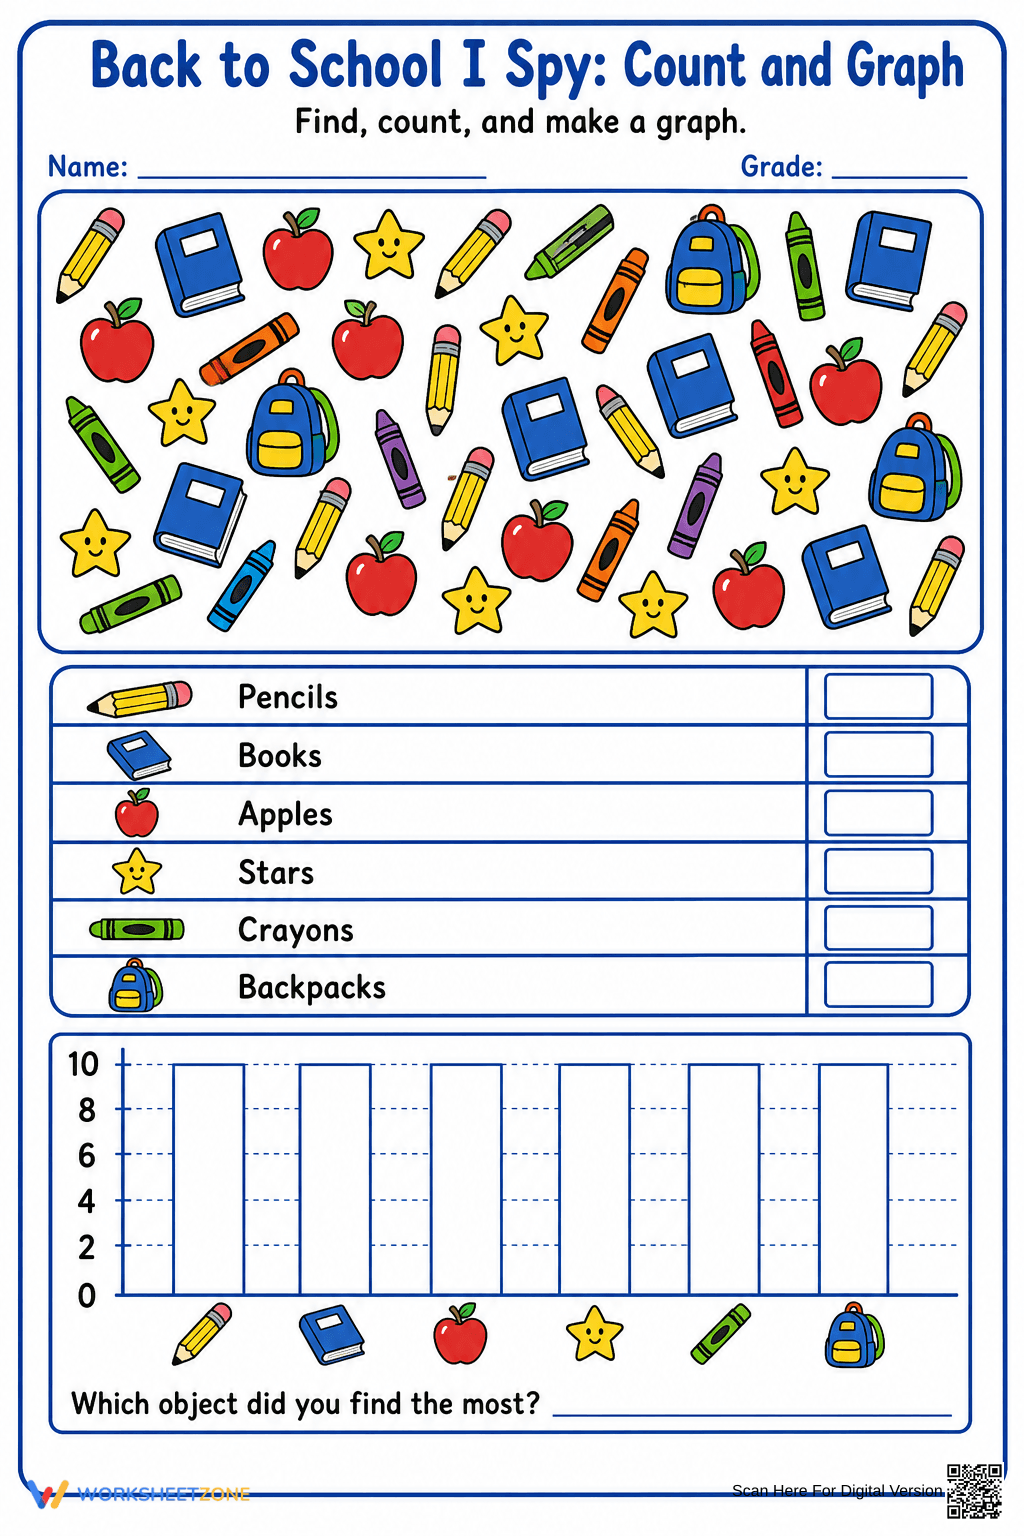
This Grade 1 math worksheet transforms data collection into an engaging "I Spy" activity. Students practice visual discrimination as they find, count, and record school-themed objects. By translating their findings into a structured bar graph, learners build a concrete understanding of how to represent and interpret information in a mathematical context.
At a Glance
- Grade: 1 · Subject: Math
- Standard:
CCSS.MATH.CONTENT.1.MD.C.4— Organize, represent, and interpret data with multiple categories and answer questions.- Skill Focus: Data Graphing & Counting
- Format: 1 page · 13 tasks · Answer key included · PDF
- Best For: Morning work or math centers
- Time: 15–20 minutes
The worksheet features a vibrant I Spy scene containing six distinct school objects: pencils, books, apples, stars, crayons, and backpacks. Below the scene, a dedicated counting table allows students to record their totals. The final section includes a pre-labeled bar graph grid and a critical thinking question to identify the most frequent object.
Zero-Prep Workflow
- Print: Select the single-page PDF and print enough copies for your class (30 seconds).
- Distribute: Hand out the sheets along with crayons or colored pencils for graphing (1 minute).
- Review: Use the included answer key to quickly check student counts and graph accuracy (1 minute).
This resource requires zero teacher preparation and is ideal for emergency sub plans or transition periods.
Standards Alignment
This resource is aligned with `CCSS.MATH.CONTENT.1.MD.C.4`, which requires students to organize, represent, and interpret data with up to three categories. While this worksheet expands to six categories for enrichment, it maintains the core requirement of asking and answering questions about the data set. Both standard codes can be copied directly into lesson plans, IEP goals, or district curriculum mapping tools.
How to Use It
Use this worksheet during the independent practice phase of a data unit. It serves as an excellent formative assessment to see if students can accurately transfer tally marks or counts to a bar graph. For a challenge, ask students to write one additional "how many more" question on the back of the page. Expected completion time is 15 to 20 minutes.
Who It's For
This is designed for Grade 1 students but works well for Kindergarten enrichment or Grade 2 review. It is particularly effective for visual learners who benefit from seeing data represented as physical objects before moving to abstract numbers. Pair this with a physical sorting activity using classroom manipulatives or an anchor chart on bar graphs.
According to the RAND AIRS 2024 report, integrating visual-spatial tasks with mathematical data representation significantly improves retention in early elementary learners. This worksheet addresses CCSS.MATH.CONTENT.1.MD.C.4 by requiring students to perform the dual tasks of data organization and interpretation. By identifying the "most" frequent object, students engage in the foundational analysis required for higher-level statistics. Research from Fisher & Frey (2014) emphasizes that "I Spy" formats reduce math anxiety by framing rigorous data collection as a game-based discovery process. This 1-page PDF provides 13 specific tasks that bridge the gap between counting and graphing, ensuring students meet grade-level expectations for data literacy. The structured layout supports executive functioning by providing a clear path from observation to recording and finally to analysis. This resource is a reliable tool for documenting student progress toward mastery in measurement and data domains.