


Views
Downloads
Parts of a Bar Graph Worksheet | Grade 6 Math Printable
Paste this activity's link or code into your existing LMS (Google Classroom, Canvas, Teams, Schoology, Moodle, etc.).
Students can open and work on the activity right away, with no student login required.
You'll still be able to track student progress and results from your teacher account.
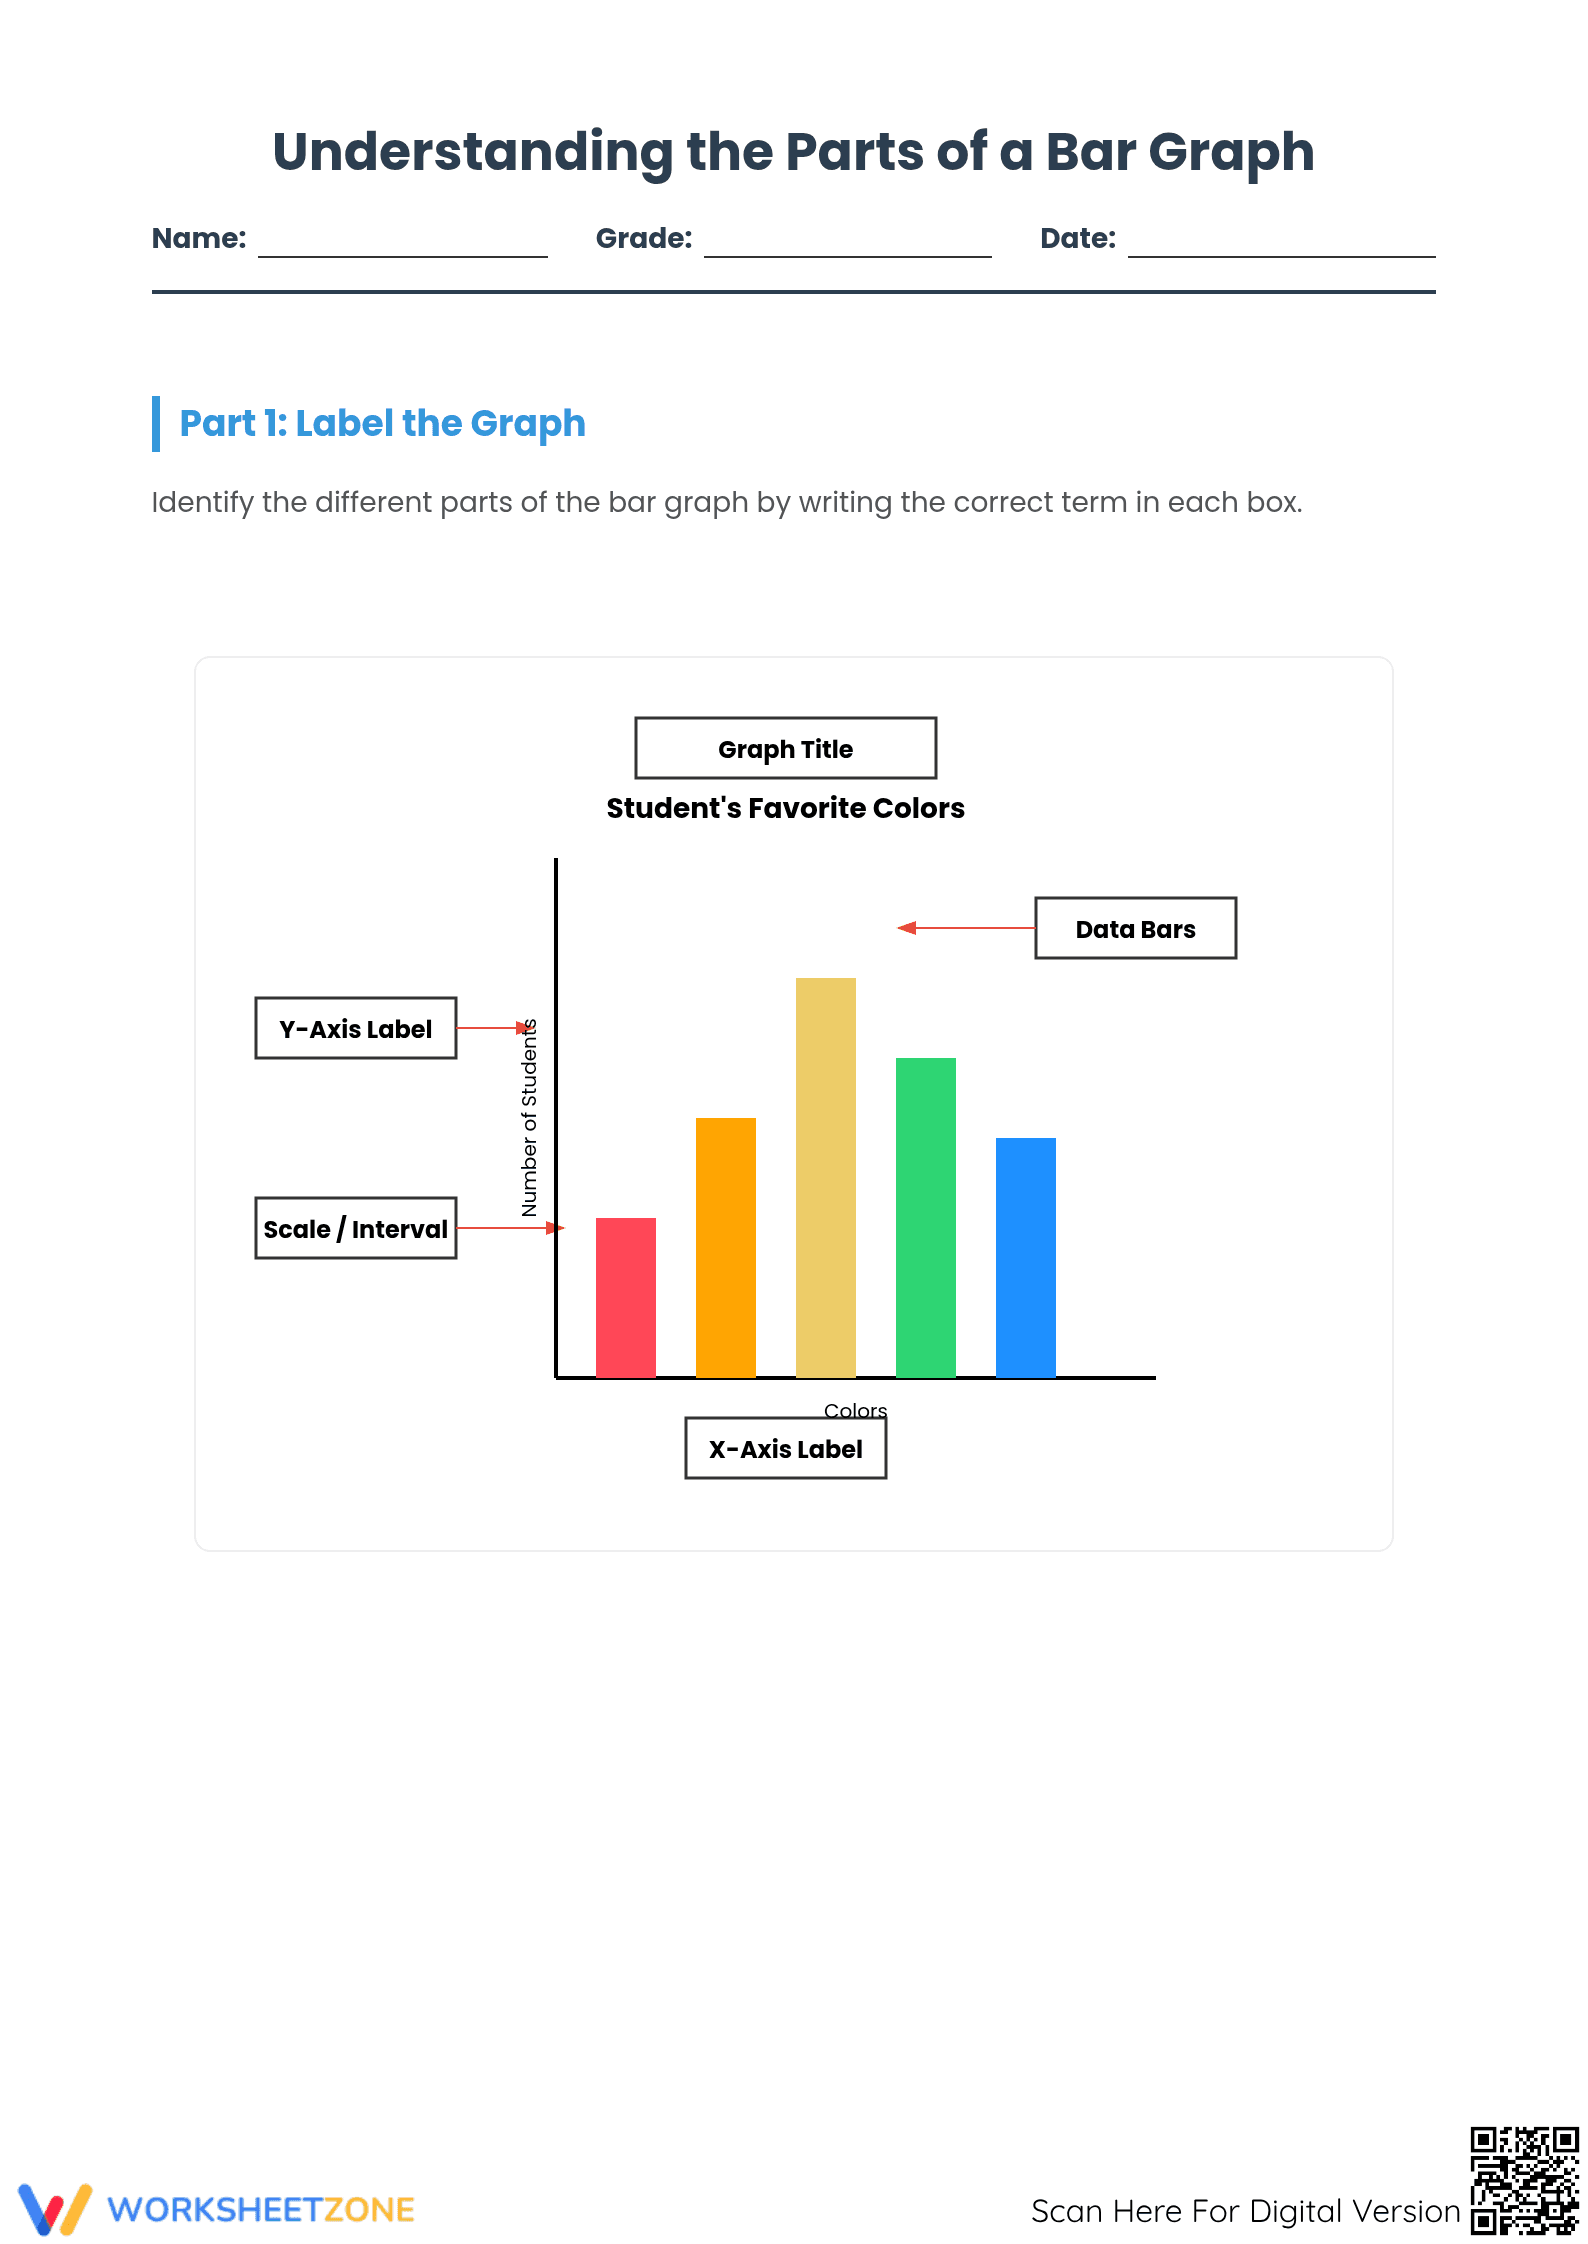
This printable math worksheet helps students master the foundational elements of data visualization by identifying and defining the essential parts of a bar graph. By labeling axes, understanding scales, and analyzing independent and dependent variables, students build the critical graphing skills needed for advanced mathematics and science coursework.
At a Glance
- Grade: 6 · Subject: Math
- Standard:
CCSS.MATH.CONTENT.6.EE.C.9— Analyze the relationship between dependent and independent variables using graphs.- Skill Focus: Identifying parts of a bar graph
- Format: 2 pages · 13 problems · Answer key included · PDF
- Best For: Independent practice or review
- Time: 15–20 minutes
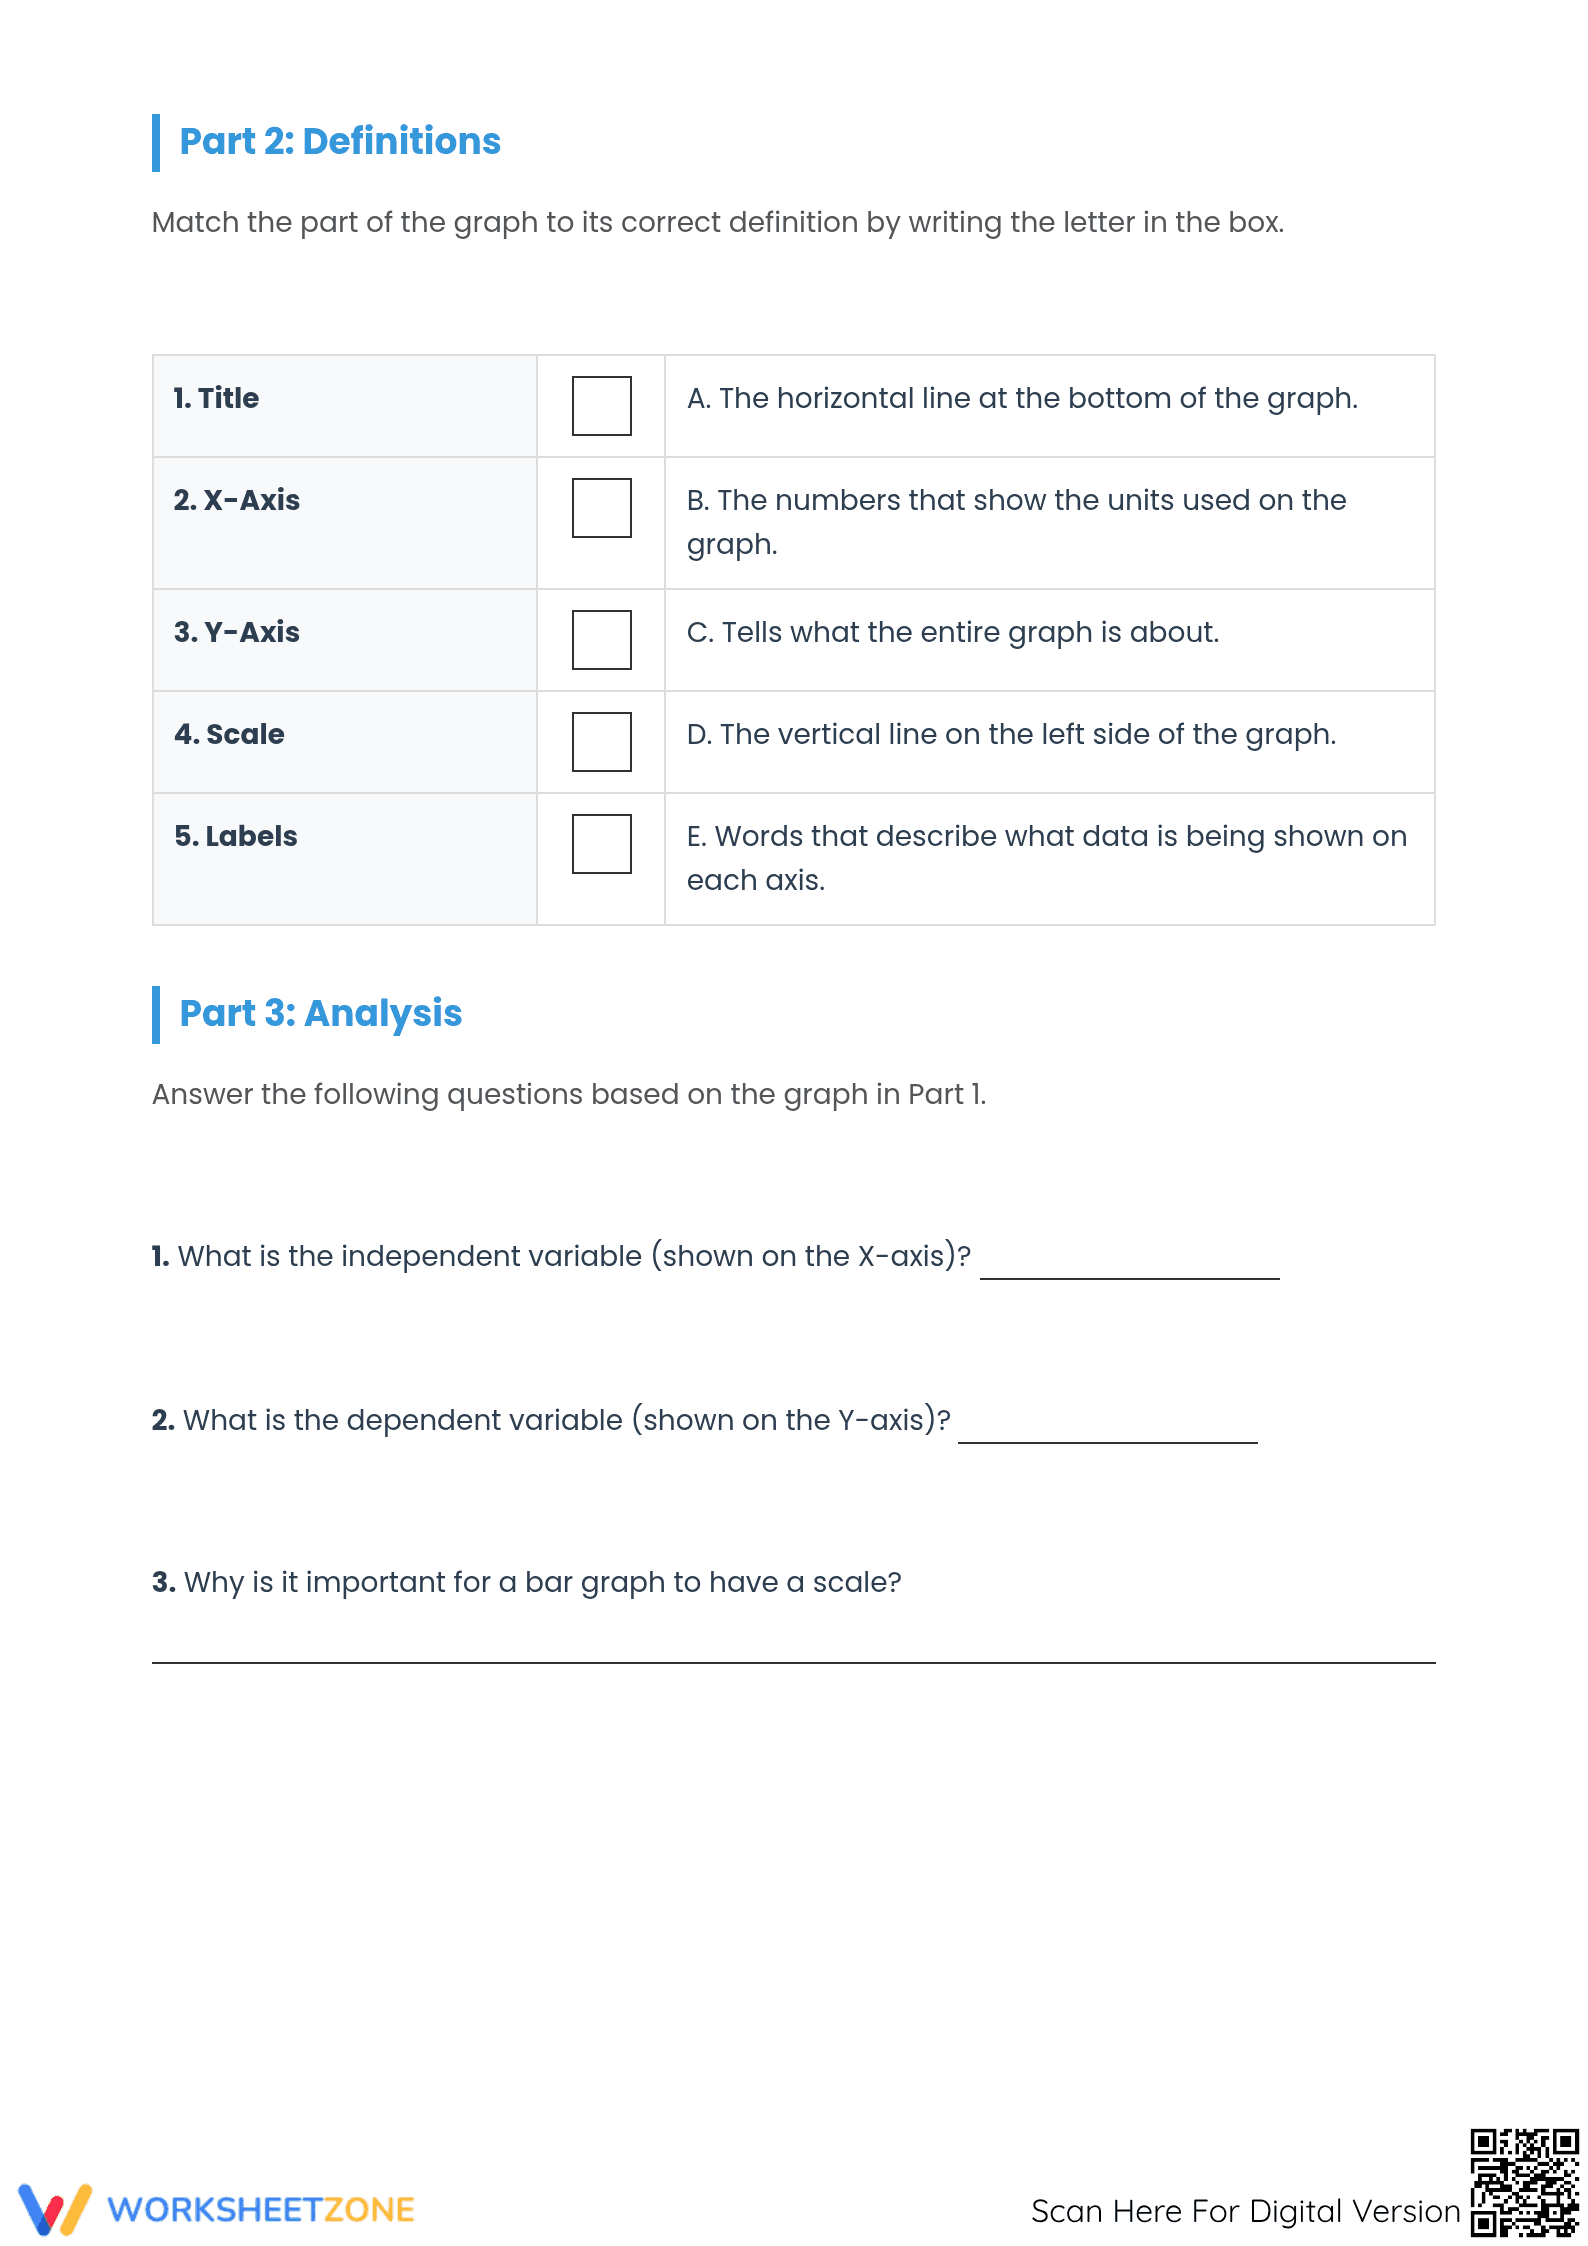
Inside this two-page resource, students will find a clear, structured approach to graphing vocabulary. The first page features a visual diagram where students label five key components of a bar graph, including the title, data bars, and axes. The second page includes a five-question matching section for definitions and three short-answer analysis questions focusing on independent and dependent variables. A complete answer key is provided for quick grading.
- Guided practice: Students begin by labeling a provided bar graph using clear visual pointers, establishing a concrete understanding of where each component belongs.
- Supported practice: Next, learners match graphing vocabulary terms to their precise definitions, reinforcing academic language and conceptual understanding.
- Independent practice: Finally, students apply their knowledge by answering analytical questions about the graph's variables and the purpose of a scale, following a gradual-release model.
Aligned to primary standard CCSS.MATH.CONTENT.6.EE.C.9: Use variables to represent two quantities in a real-world problem that change in relationship to one another; analyze the relationship between the dependent and independent variables using graphs and tables. This foundational practice also supports general data literacy. Both standard codes can be copied directly into lesson plans, IEP goals, or district curriculum mapping tools.
This resource is highly versatile for middle school classrooms. Use it as a formative assessment after an introductory lesson on data visualization to check for understanding of graphing terminology. Alternatively, assign it as a focused bell-ringer or homework assignment before beginning a larger science or math project that requires students to construct their own graphs. Teachers can easily observe if students are confusing the x-axis and y-axis during the labeling portion. Expected completion time is 15 to 20 minutes.
Designed primarily for 6th-grade math and science students, this worksheet is also an excellent review tool for 7th and 8th graders who need a refresher on graphing basics. The clear visual layout and matching format provide built-in scaffolding, making it accessible for English Language Learners and students needing vocabulary support. It pairs perfectly with an anchor chart displaying a fully labeled graph.
Integrating explicit vocabulary instruction into graphing lessons significantly improves student data literacy and analytical skills. Aligned with CCSS.MATH.CONTENT.6.EE.C.9, this resource requires students to analyze the relationship between dependent and independent variables using graphs. According to a comprehensive EdReports 2024 analysis, instructional materials that explicitly connect visual data representations with their corresponding academic vocabulary lead to much higher retention rates in middle school mathematics. By breaking down the parts of a bar graph into distinct labeling, defining, and analytical tasks, this worksheet ensures learners do not just memorize terms, but truly understand their functional purpose in data display. Mastery of these foundational graphing elements is absolutely essential for success in subsequent STEM coursework, where accurate data interpretation relies heavily on correctly identifying axes, scales, and variables.