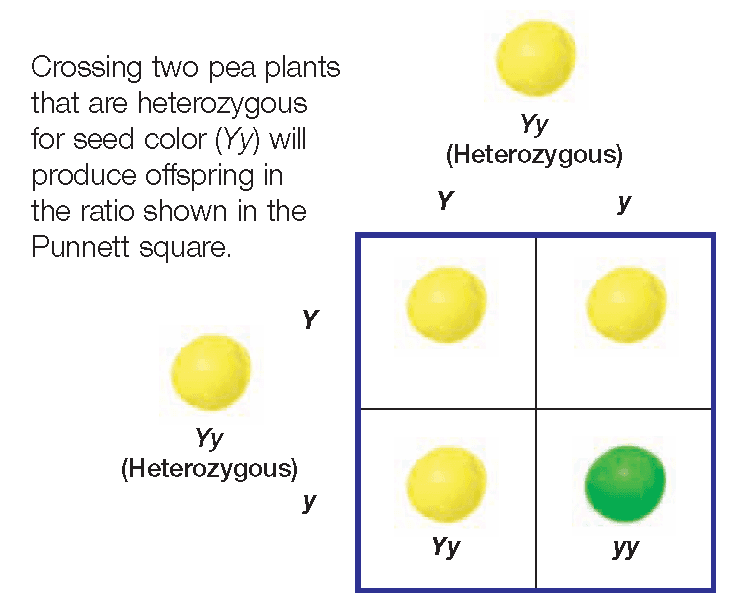
These monohybrid cross worksheets for 9th grade give biology teachers a print-ready set of resources that move students from decoding a word problem to filling in a Punnett square to interpreting the ratios that result. The set covers the Law of Segregation, dominant and recessive allele relationships, genotypic and phenotypic probability, and the vocabulary students need before any single-trait inheritance problem makes sense.
Skills Each Worksheet Builds
The worksheets follow a deliberate sequence. Early practice presents parent genotypes directly — students place alleles on the outside of the two-by-two grid, combine them in the four inner boxes, and write the resulting ratios. Later worksheets shift the entry point: students read a word problem, extract genotype information from trait descriptions like "purebred tall" or "hybrid seed color," and determine parent genotypes before drawing anything. This ordering matters because the Punnett square procedure and the word-problem translation are two separate cognitive tasks, and asking students to perform both simultaneously before they've practiced either is the fastest path to avoidance.
Across the set, students practice:
- Translating dominant and recessive trait descriptions into correct allele notation
- Identifying homozygous dominant, homozygous recessive, and heterozygous genotypes from word-problem clues like "true-breeding" or "hybrid"
- Setting up the Punnett square grid with parent alleles correctly separated on perpendicular axes
- Recording offspring genotypes in standard form — dominant allele written first
- Expressing results as genotypic ratios (1:2:1), phenotypic ratios (3:1), fractions, and percentages
- Working backward from offspring ratios to determine unknown parent genotypes
The monohybrid cross worksheets for 9th grade set also includes vocabulary practice — matching terms, fill-in-the-blank definitions, and short-answer prompts that ask students to explain in their own words why a recessive trait can disappear in one generation and reappear in the next.
Frequent Student Errors Worth Watching For
The most predictable error happens at the grid setup stage. Students who correctly identify "Tt" as heterozygous still place both alleles — T and t — along the same top row instead of separating them on perpendicular axes. The result is a Punnett square with the right letters in the wrong configuration, producing offspring genotypes that look plausible enough that students don't flag the error themselves. Checking grid setup before students fill in the inner boxes catches this before it compounds across the whole problem.
A second consistent error is conflating genotypic and phenotypic ratios. After completing a Tt × Tt cross, students count one TT, two Tt, and one tt, correctly write 1:2:1 as the genotypic ratio — then write 1:2:1 again when asked for the phenotypic ratio. They're counting genotypes rather than grouping TT and Tt together as organisms that both display the dominant phenotype. Worksheets that use separate answer lines for each ratio, with a brief prompt asking students to identify which genotypes share a phenotype, force this distinction into the open.
A third error is subtler: students treat 3/4 probability as a guarantee. After finding a 3:1 phenotypic ratio, they write that "3 out of 4 offspring will be tall" rather than "there is a 75% chance that any given offspring will be tall." Word problems that ask for the probability of a single specific offspring — rather than offspring in general — surface this misconception reliably.
Lesson-Planning Moves That Get the Most From This Set
The natural entry point for these worksheets is right after students encounter Mendel's pea plant experiments for the first time — before they've attempted any cross independently. A worksheet that provides parent genotypes directly lets students practice the mechanical steps of grid setup without simultaneously wrestling with vocabulary translation. That first successful cross matters. Students who get one right are far more willing to attempt the word-problem version the next day.
For formative assessment, one worksheet from the monohybrid cross worksheets for 9th grade set works well as an exit ticket at the end of any genetics lesson. A Tt × Tt cross takes most students under five minutes, and the results tell you immediately who is confusing genotypic and phenotypic ratios and who is ready to move toward dihybrid crosses. Grading eight or ten of those before the next class is manageable and gives precise information about where instruction needs to go next.
Partner work also makes good use of these resources. Have one student read the word problem aloud while the other records the parent genotype notation — then swap roles for the grid setup. Students who quietly fill in boxes incorrectly often catch the error the moment they have to explain the step to someone else.
Adapting These Worksheets Across Student Readiness Levels
For students who struggle to get started with word problems, a vocabulary reference card placed alongside each worksheet reduces the bottleneck considerably. An even more effective support is having those students mark up the word problem in two colors before writing anything — one color for phenotype descriptions like "tall" or "white flowers," and another for genotype clues like "purebred" or "heterozygous." That physical act of annotating the text slows students down enough to extract the correct parent genotypes before they reach for a pencil to draw the grid.
Students who move through the standard set quickly can work on reverse-inference problems: given a set of offspring ratios, determine what the parent genotypes must have been. A 3:1 phenotypic outcome tells you at least one parent was heterozygous — but which one, and what was the other parent's genotype? Working through that reasoning requires considerably more genetic thinking than filling in a grid from a provided cross. Introducing scenarios where all offspring display the dominant phenotype and asking students what that tells them about the possible range of parent genotypes pushes students toward understanding the biology rather than executing a procedure.
Standard Alignment
These worksheets address NGSS HS-LS3-3: Apply concepts of statistics and probability to explain the variation and distribution of expressed traits in a population. In classroom terms, this is the standard that moves 9th-grade genetics instruction beyond the idea that a dominant allele simply "beats" a recessive one. It requires students to calculate, express, and interpret probability — and to articulate what those numbers mean for actual offspring rather than just for the four boxes on a grid. The monohybrid cross worksheets for 9th grade resources address HS-LS3-3 directly by requiring students to express cross results as fractions, percentages, and ratios, and to explain the probabilistic nature of those outcomes in short-answer responses. Many state-level biology standards include companion performance expectations around heredity at this grade band; HS-LS3-3 is the most commonly cited anchor for single-trait probability work at the 9th-grade level.
Frequently Asked Questions
How do I decide whether to assign a genotype-provided worksheet or a word-problem version?
Assign the genotype-provided version first. Once students can set up and complete the grid accurately on two or three consecutive attempts without prompting, introduce word problems. If students get the grid right but consistently cannot start the word problem, the block is almost always a vocabulary gap — they need more work connecting terms like "true-breeding" and "hybrid" to actual allele notation before word problems become productive practice rather than frustration.
What is the difference between the genotypic ratio and the phenotypic ratio, and why does it matter?
The genotypic ratio describes the distribution of allele combinations among offspring — for a Tt × Tt cross, that's 1 TT : 2 Tt : 1 tt. The phenotypic ratio groups organisms by observable trait, combining TT and Tt because both display the dominant phenotype, giving a 3:1 ratio under complete dominance. The two ratios are equal only when each genotype produces a visually distinct phenotype, as in incomplete dominance. That distinction — understanding why TT and Tt get grouped together — is the conceptual test of whether a student genuinely understands dominance rather than just knowing how to fill in the grid.
Do the worksheets cover test crosses?
Yes. Several worksheets include test cross problems: a student is given an organism displaying the dominant phenotype but with an unknown genotype — either homozygous dominant or heterozygous — and is asked to determine which genotype it carries by crossing it with a homozygous recessive individual. This is one of the most instructive problem types in Mendelian genetics because it connects probability outcomes directly to experimental reasoning. Students have to think about what result would actually distinguish the two possible parent genotypes, rather than simply filling in a grid they've already been handed.
How should I address the probability language issue when students interpret Punnett square ratios as guarantees?
State the distinction explicitly and return to it more than once. A 3:1 phenotypic ratio means each individual offspring has a 75% chance of displaying the dominant trait — it does not mean exactly three out of every four offspring in a given litter will. Word problems that specify a small group of offspring, like a litter of eight, reliably surface this misconception: students will write that exactly six will be dominant and two will be recessive. Use those moments to reinforce the difference between probability and guaranteed outcome in any specific case, and ask students to rewrite their answers using language like "the probability is" rather than "there will be."