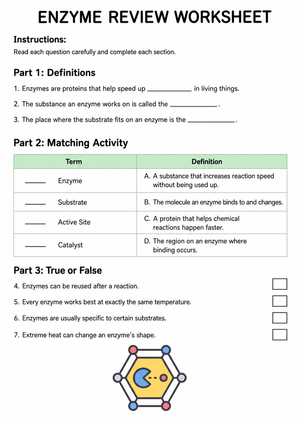
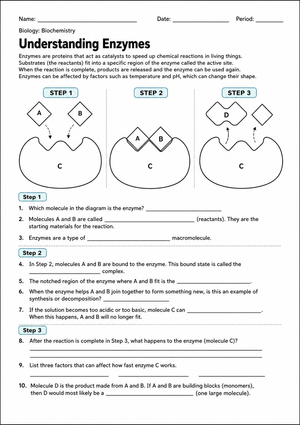
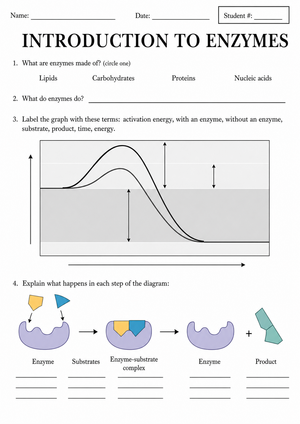
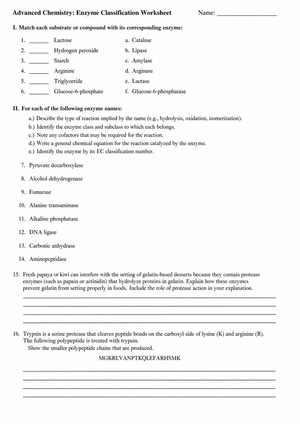
These enzyme printable worksheets for 9th grade give teachers a ready set of focused resources that move students from basic diagram labeling through data analysis and real-world application — all within the same introductory unit. Each worksheet stands alone, so they can be assigned selectively depending on where a class is in the sequence, or pulled individually when one particular concept needs extra reinforcement before a lab or assessment.
The Specific Skills Each Worksheet Builds
The set addresses the full range of 9th-grade enzyme content, from foundational vocabulary to quantitative interpretation. Skills vary by worksheet but collectively include:
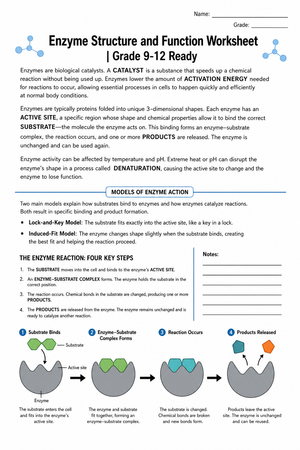
- Labeling the active site, substrate, enzyme-substrate complex, and products on diagram-based tasks
- Comparing the lock-and-key and induced fit models by annotating or drawing the binding interaction
- Constructing and reading energy profile diagrams — marking activation energy with and without an enzyme, the transition state, and overall free energy change
- Plotting reaction rate data against temperature, pH, and substrate concentration and interpreting the resulting curves
- Explaining denaturation in terms of structural change rather than just stating that the enzyme stops working
- Connecting enzyme specificity to real-world cases: lactase and lactose intolerance, pepsin's acid requirement, catalase in liver tissue
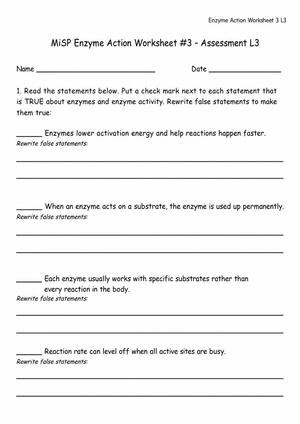
The graphing worksheets deserve particular attention. Reaction-rate-versus-substrate-concentration curves are a consistent area of confusion — students often misread the plateau as evidence the enzyme broke, when it signals that all active sites are occupied. Each graphing worksheet also includes short-answer prompts that push students to articulate what the curve is showing, not just draw it.
Student Misconceptions Worth Catching Before They Harden
The enzyme unit generates a predictable set of student errors that, if left unaddressed, carry into cellular respiration and digestion units. The most stubborn: students believe enzymes are consumed in the reaction. This shows up in written explanations where students describe the enzyme-substrate complex forming and then list both the enzyme and the products as "what comes out" — as though the enzyme is spent like a reactant. Several worksheets ask students to trace what happens to the enzyme after the products are released, specifically to surface and correct this idea.
A second error appears on energy profile diagrams: students draw the enzyme lowering the energy of the products, not just the activation energy peak. They understand intuitively that enzymes help the reaction, and they interpret "help" as making the end state more favorable — which is not what's happening. The energy profile tasks in this set require students to mark where the enzyme's effect appears on the diagram, and the products' energy level is left unlabeled separately, so students have to make a deliberate decision about where to place their annotation.
There is also consistent confusion between denaturation and inhibition. Students learn that high temperature destroys enzyme function and assume any reduction in activity is permanent structural damage. Worksheets that pair written scenarios with graph data — such as "the enzyme was cooled back to 37°C after reaching 80°C; predict the reaction rate" — force students to reason about whether a change was reversible or structural, which is a distinction that matters in both the unit exam and later units on cell regulation.
Fitting These Worksheets Into the Unit Without Overloading the Schedule
The most effective placement depends on the lesson's purpose. Labeling worksheets fit naturally as Monday warm-ups after a lecture on enzyme structure, giving students 8–10 minutes to consolidate vocabulary before the class moves into a new application. Energy profile diagrams work well as pre-lab activities — having students complete the diagram worksheet before a catalase and hydrogen peroxide demonstration means the lab observation connects directly to a mental model students already have on paper.
Graphing worksheets are stronger as formative mid-unit checks than as homework. When students complete them independently in class, the patterns in their errors become visible immediately. If half the class draws the substrate-concentration curve continuing to rise without a plateau, that is a gap worth addressing before the next lesson, not after a test. These enzyme printable worksheets for 9th grade support that kind of real-time instructional adjustment because each worksheet isolates one variable or concept, making it easier to see exactly where understanding breaks down.
Exit tickets are another natural fit. A single worksheet focused only on denaturation — where students must distinguish between an enzyme that has been inhibited and one that has been denatured, using two short scenarios to analyze — takes under five minutes and generates clear feedback on whether students are ready to move forward.
Standard Alignment
NGSS HS-LS1-1 — From Molecules to Organisms: Structures and Processes — is the primary standard this set addresses. It calls on students to explain how the structure of DNA determines the structure of proteins, which in turn determines their function. In classroom terms, that means students need to understand that an enzyme's active site shape is not arbitrary — it follows from the protein's amino acid sequence — and that altering the shape through denaturation or changes in pH eliminates function. The diagram and short-answer tasks in this set keep structure-function reasoning at the center, not just procedural labeling.
The data analysis worksheets also connect to NGSS Science and Engineering Practice 4 (analyzing and interpreting data) and Practice 6 (constructing explanations). Teachers using these worksheets as lab preparation or follow-up will find that the prompts explicitly ask students to construct written explanations for graph trends — which aligns with how these practices appear in performance expectations at the high school level.
Adjusting the Set for Students at Different Entry Points
Students entering 9th-grade biology with weak middle school chemistry backgrounds often hit a wall on activation energy. The abstract idea that a reaction requires an energy input before it can release energy does not connect intuitively for many students. For these learners, the energy profile worksheets work better when the teacher introduces an analogy first — a ball sitting at the edge of a hill that needs a push before it rolls down — and then has students use the worksheet to formalize what the analogy means in chemical terms. The worksheet becomes structured practice rather than first exposure to a concept that is still forming.
For students who move through the core content quickly, the inhibition scenario worksheets provide meaningful extension. Competitive inhibition versus non-competitive inhibition is not always covered in depth at the 9th-grade level, but strong students can handle predicting how each type of inhibitor would shift the reaction rate graph and why. These enzyme printable worksheets for 9th grade include inhibition content as optional extension tasks on select worksheets, so it does not add confusion for students still working through the basics.
Students with reading-heavy IEP accommodations benefit from worksheets that lead with the diagram and place text prompts beneath it, rather than worksheets that embed the diagram inside a paragraph of instructions. The set contains both formats, giving teachers flexibility in making appropriate assignments without creating entirely separate resources from scratch.
Frequently Asked Questions
Do students need prior lab experience before using these worksheets?
No — each worksheet works as pre-lab preparation, post-lab reinforcement, or standalone classroom practice. The catalase-related content works particularly well before a hydrogen peroxide demonstration, because students arrive at the lab with the enzyme-substrate relationship already mapped out on paper. But the worksheets are written to stand without assuming prior lab experience.
How do the graphing worksheets handle students who struggle with setting up a coordinate plane?
Each graphing worksheet provides pre-labeled axes with the independent variable, dependent variable, and scale already established. Students plot the data points and draw the curve — they are not asked to build the graph from scratch. This keeps the focus on biological interpretation rather than on graph construction, which is a separate math skill that many 9th graders are still solidifying. These enzyme printable worksheets for 9th grade treat the graph as a tool for reasoning about biology, not as a math assessment.
Can these be used effectively in a co-taught or inclusion setting?
Yes. Because the worksheets vary in text density and diagram complexity, co-teachers can assign different worksheets to different students within the same class period without it being obvious that students are doing different work. The labeling worksheets include word banks; the scenario-based worksheets do not. That difference alone creates a natural tier without requiring separate materials to be printed and managed across two sets of students.
Are answer keys included with each worksheet?
Yes, each worksheet comes with a corresponding answer key. For diagram tasks, the key marks correct label placements. For short-answer questions, it provides model responses — particularly useful for questions about denaturation and the induced fit model, where student wording varies significantly and it helps to have a reference for what a complete explanation looks like before returning the work.