


1 / 4
0
Views
0
Downloads


0.0
0
Save
0 Likes
Pizza Pictograph Math Worksheet - Interpret Data & Solve Problems
0 Views
0 Downloads
Paste this activity's link or code into your existing LMS (Google Classroom, Canvas, Teams, Schoology, Moodle, etc.).
Students can open and work on the activity right away, with no student login required.
You'll still be able to track student progress and results from your teacher account.
Information
Description
What It Is:
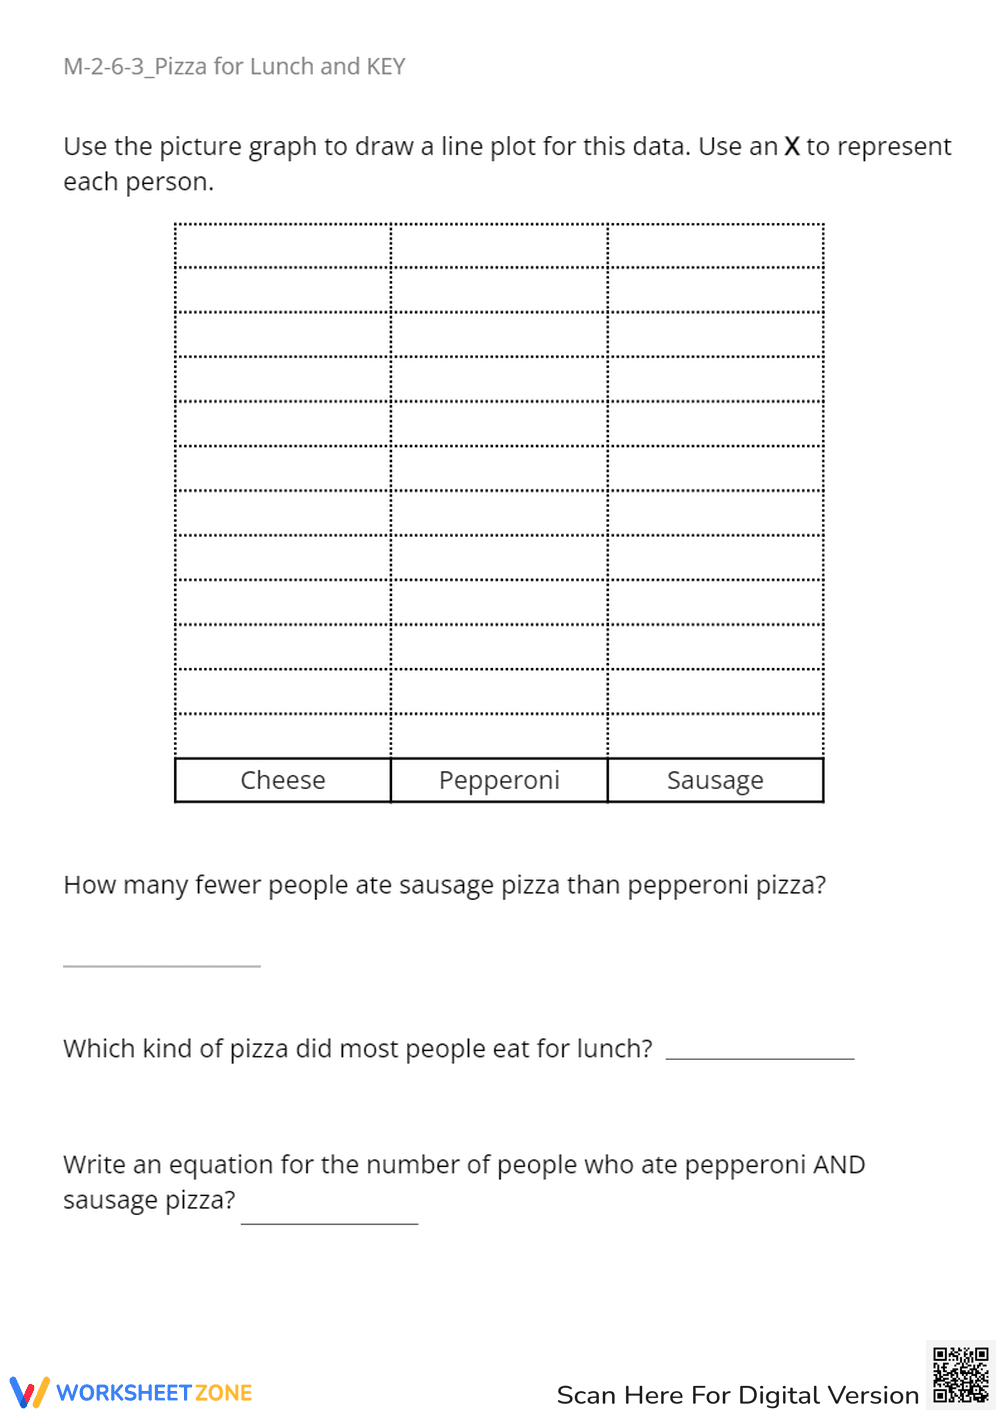
This is a math worksheet titled 'Pizza for Lunch' that uses a pictograph to represent data. The pictograph shows the number of people who ate cheese, pepperoni, and sausage pizza for lunch, with each pizza slice representing 3 people. Below the pictograph, there are five word problems that require students to interpret the data and perform calculations to answer questions about the number of people who ate each type of pizza, and comparisons between them.
Grade Level Suitability:
This worksheet is suitable for 2nd and 3rd grade. It reinforces data interpretation, counting, and basic arithmetic skills like addition and subtraction within the context of a simple pictograph. The concept of each picture representing a group of items is appropriate for this age range.
Why Use It:
This worksheet provides a fun and engaging way for students to practice data analysis and problem-solving skills. It helps them understand how to read and interpret pictographs, perform simple calculations based on the data presented, and answer questions related to the data. It also reinforces the concept of using pictures to represent quantities.
How to Use It:
Students should first examine the pictograph and understand that each pizza slice represents 3 people. Then, they should count the number of pizza slices for each flavor (cheese, pepperoni, sausage). After that, they should multiply the number of pizza slices by 3 to determine the total number of people who ate each type of pizza. Finally, they can use this information to answer the word problems by performing addition or subtraction as needed.
Target Users:
This worksheet is designed for elementary school students, particularly those in 2nd and 3rd grade, who are learning about data interpretation, pictographs, and basic arithmetic. It can also be used for students who need extra practice with these concepts.