


Views
Downloads
Printable Line Plot Worksheet | Grade 3 Math Essential
Paste this activity's link or code into your existing LMS (Google Classroom, Canvas, Teams, Schoology, Moodle, etc.).
Students can open and work on the activity right away, with no student login required.
You'll still be able to track student progress and results from your teacher account.
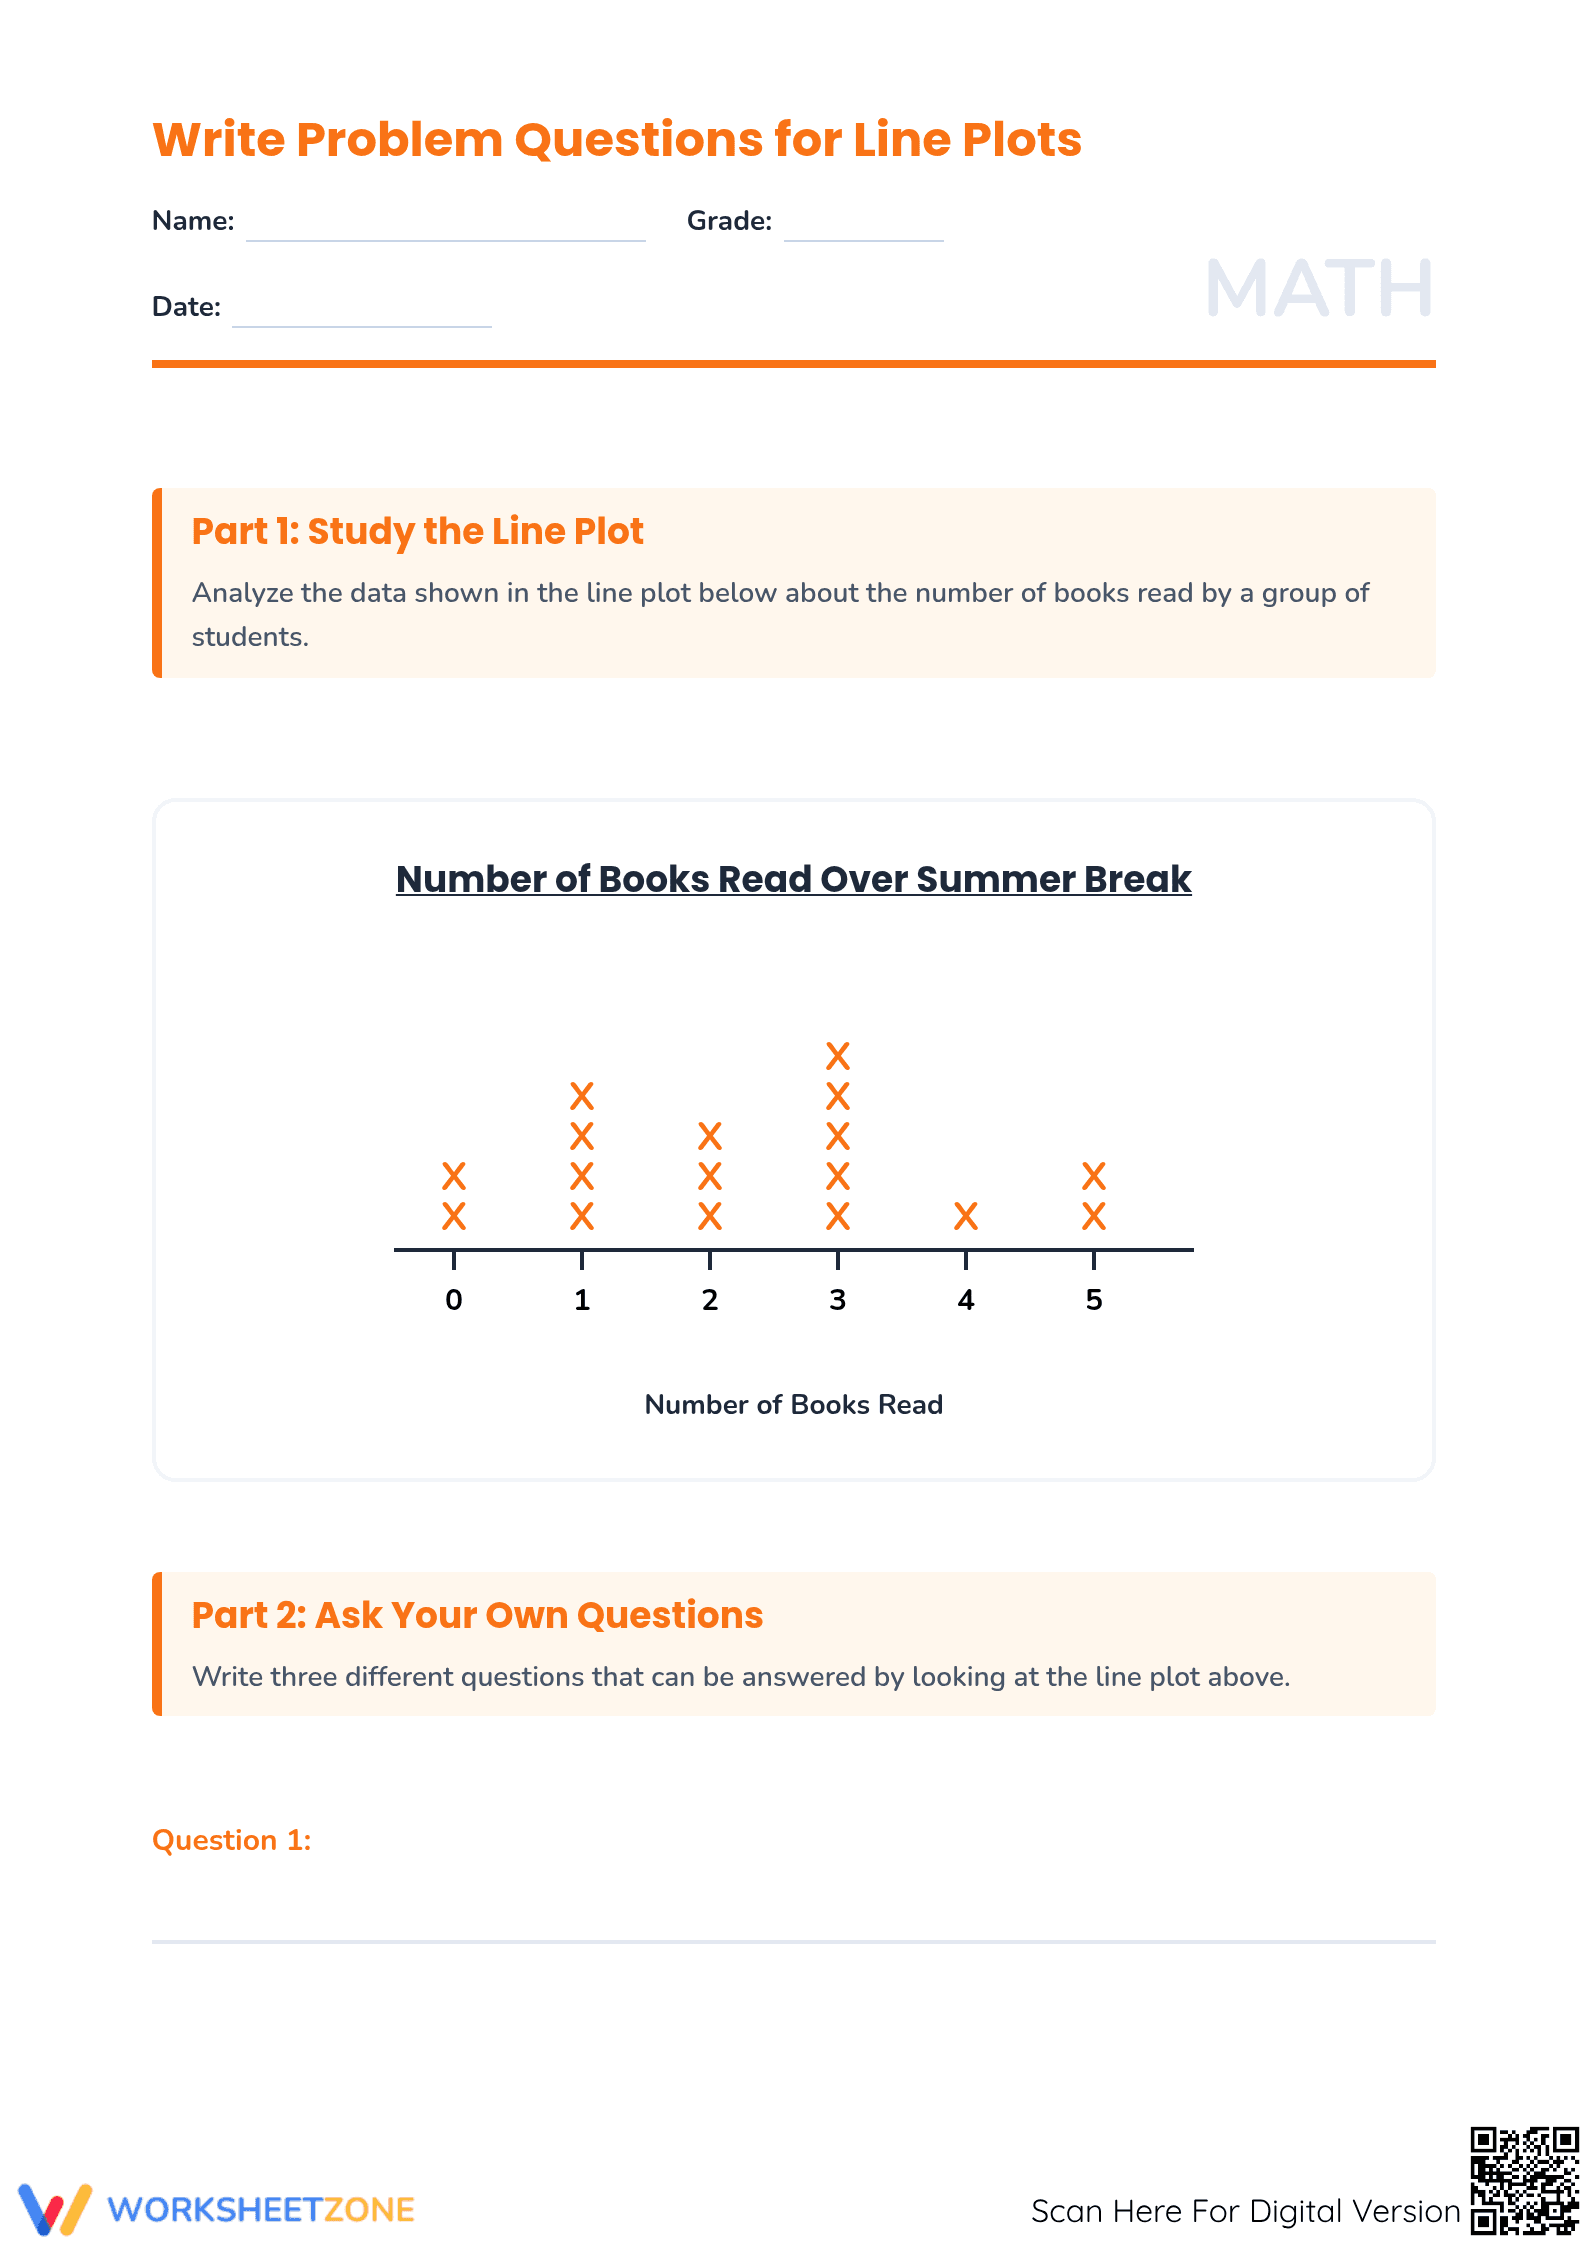
This Grade 3 math worksheet helps students master data analysis by interpreting line plots and converting visual information into structured tables. Using real-world summer reading data, students develop critical thinking, generate mathematical inquiries, and interpret trends across multiple data points.
At a Glance
- Grade: 3 · Subject: Math
- Standard:
3.MD.B.4— Generate measurement data and show the data by making a line plot- Skill Focus: Line plot analysis and data table creation
- Format: 3 pages · 7 tasks · Answer key included · PDF
- Best For: Small group instruction or independent practice
- Time: 30–40 minutes
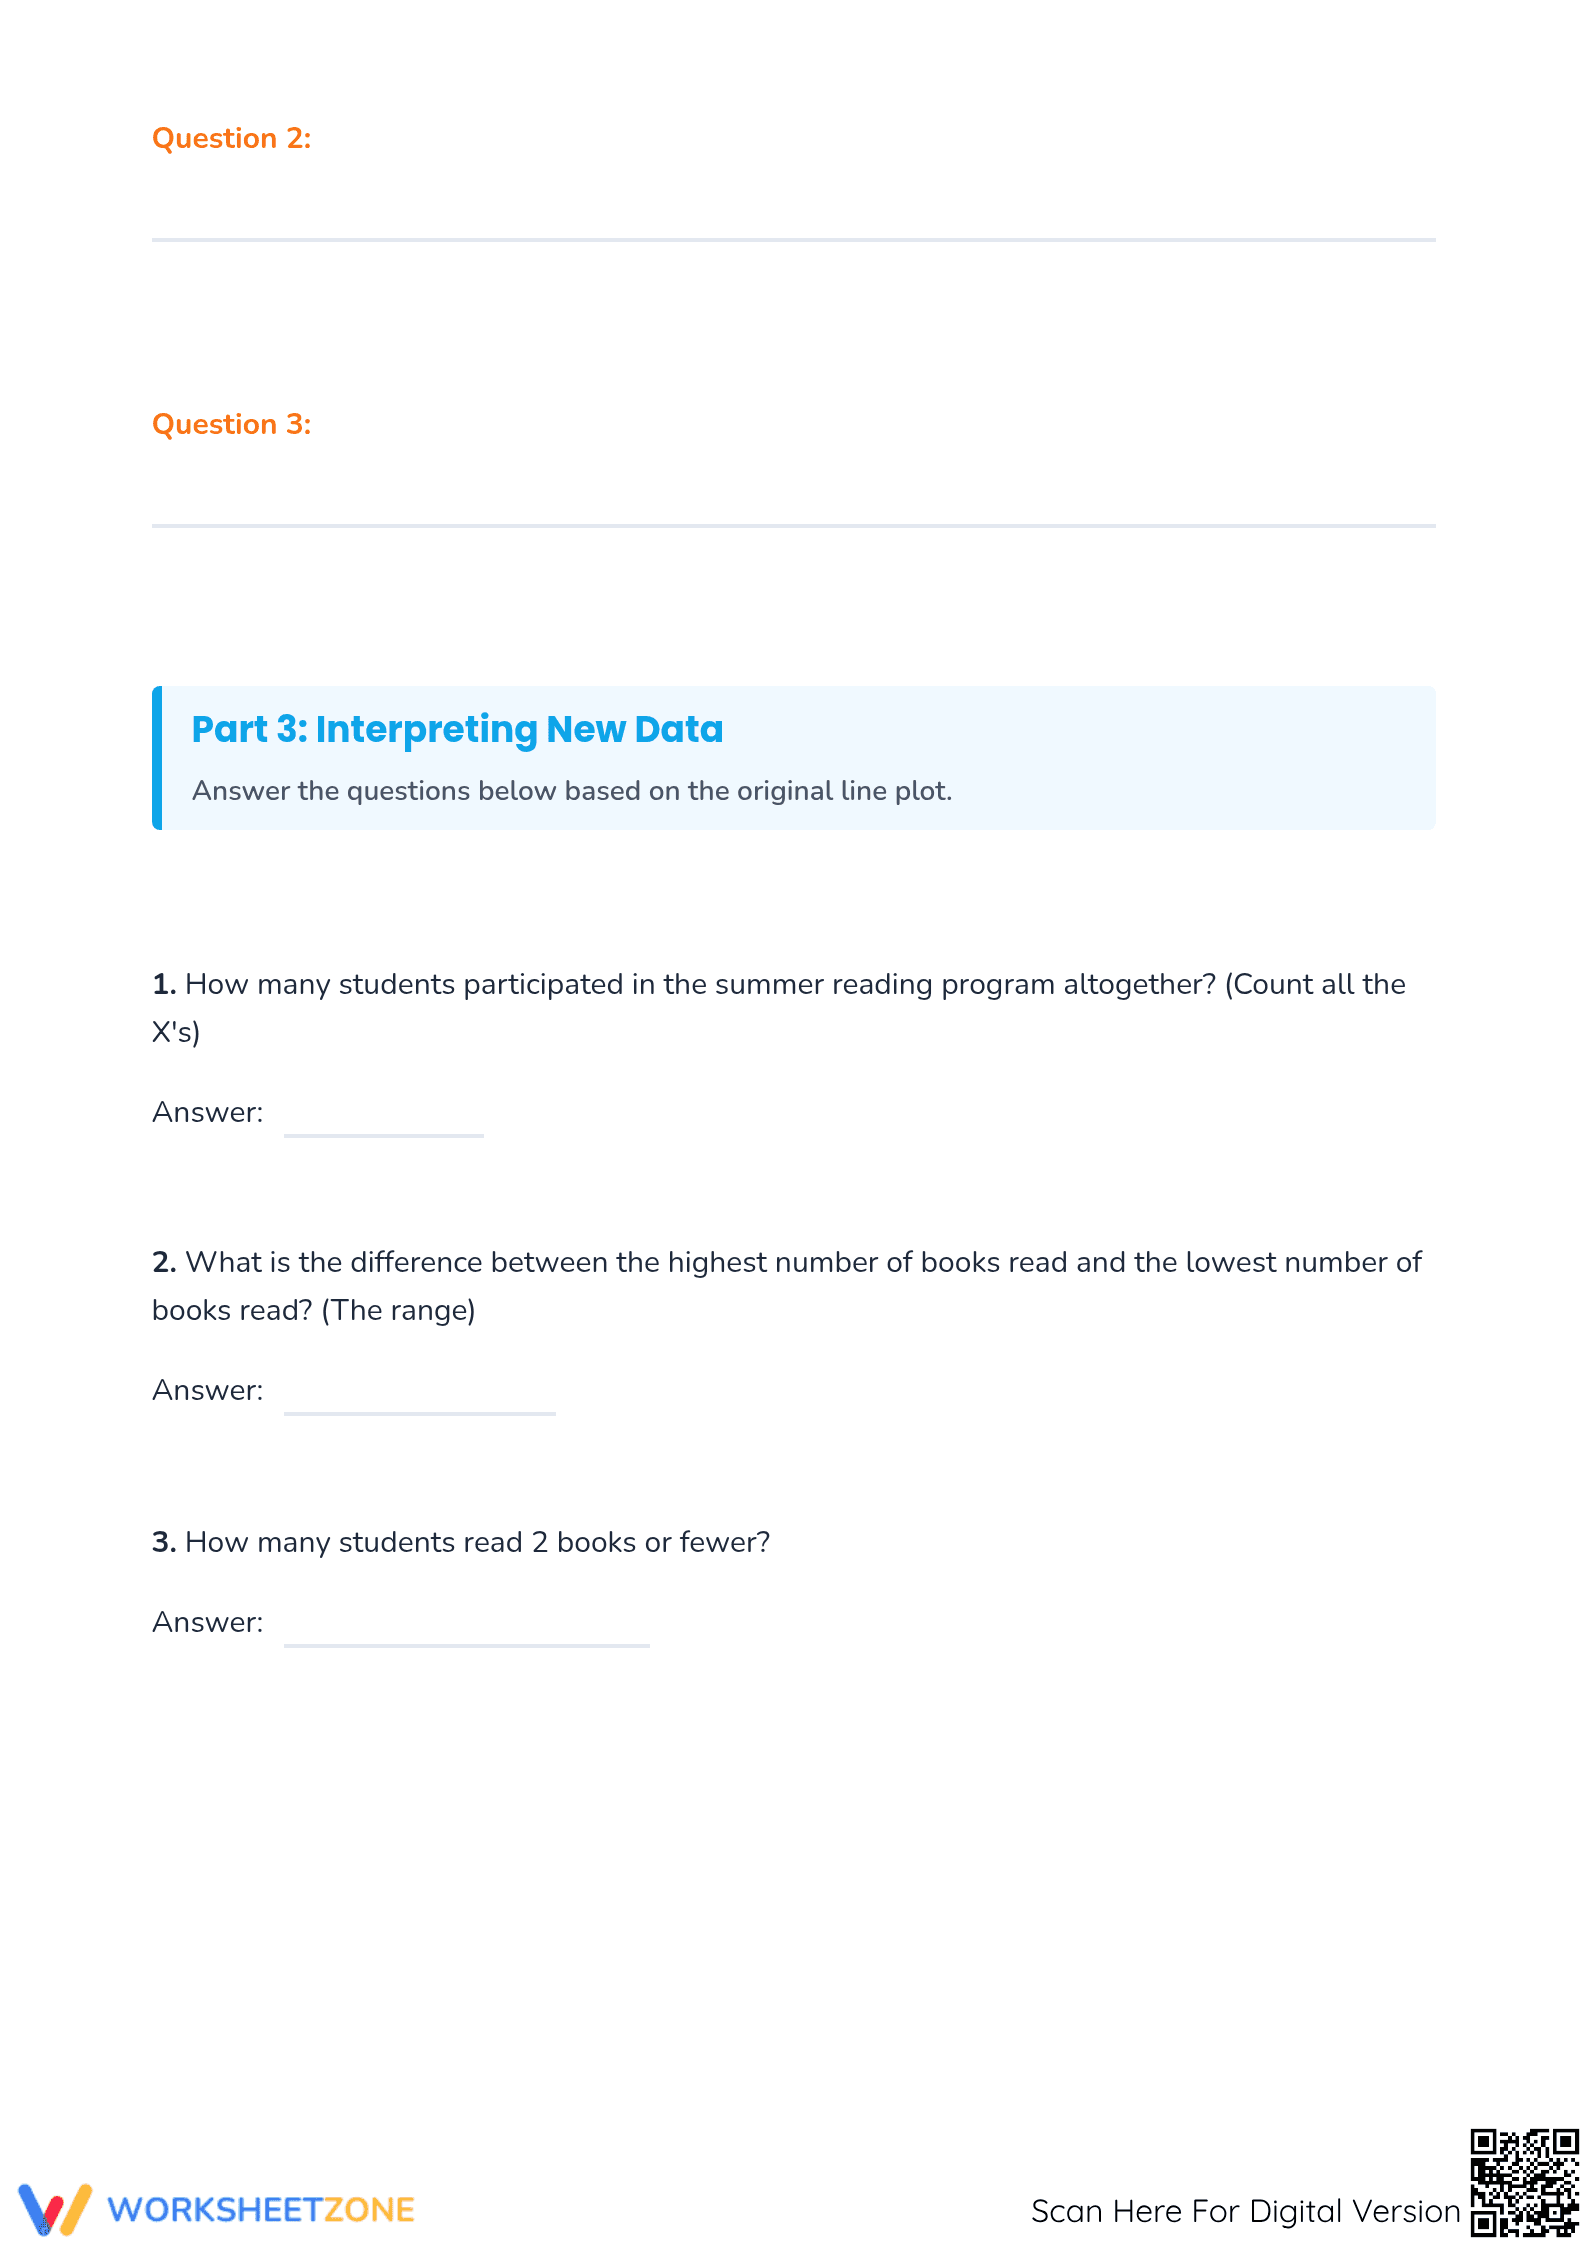
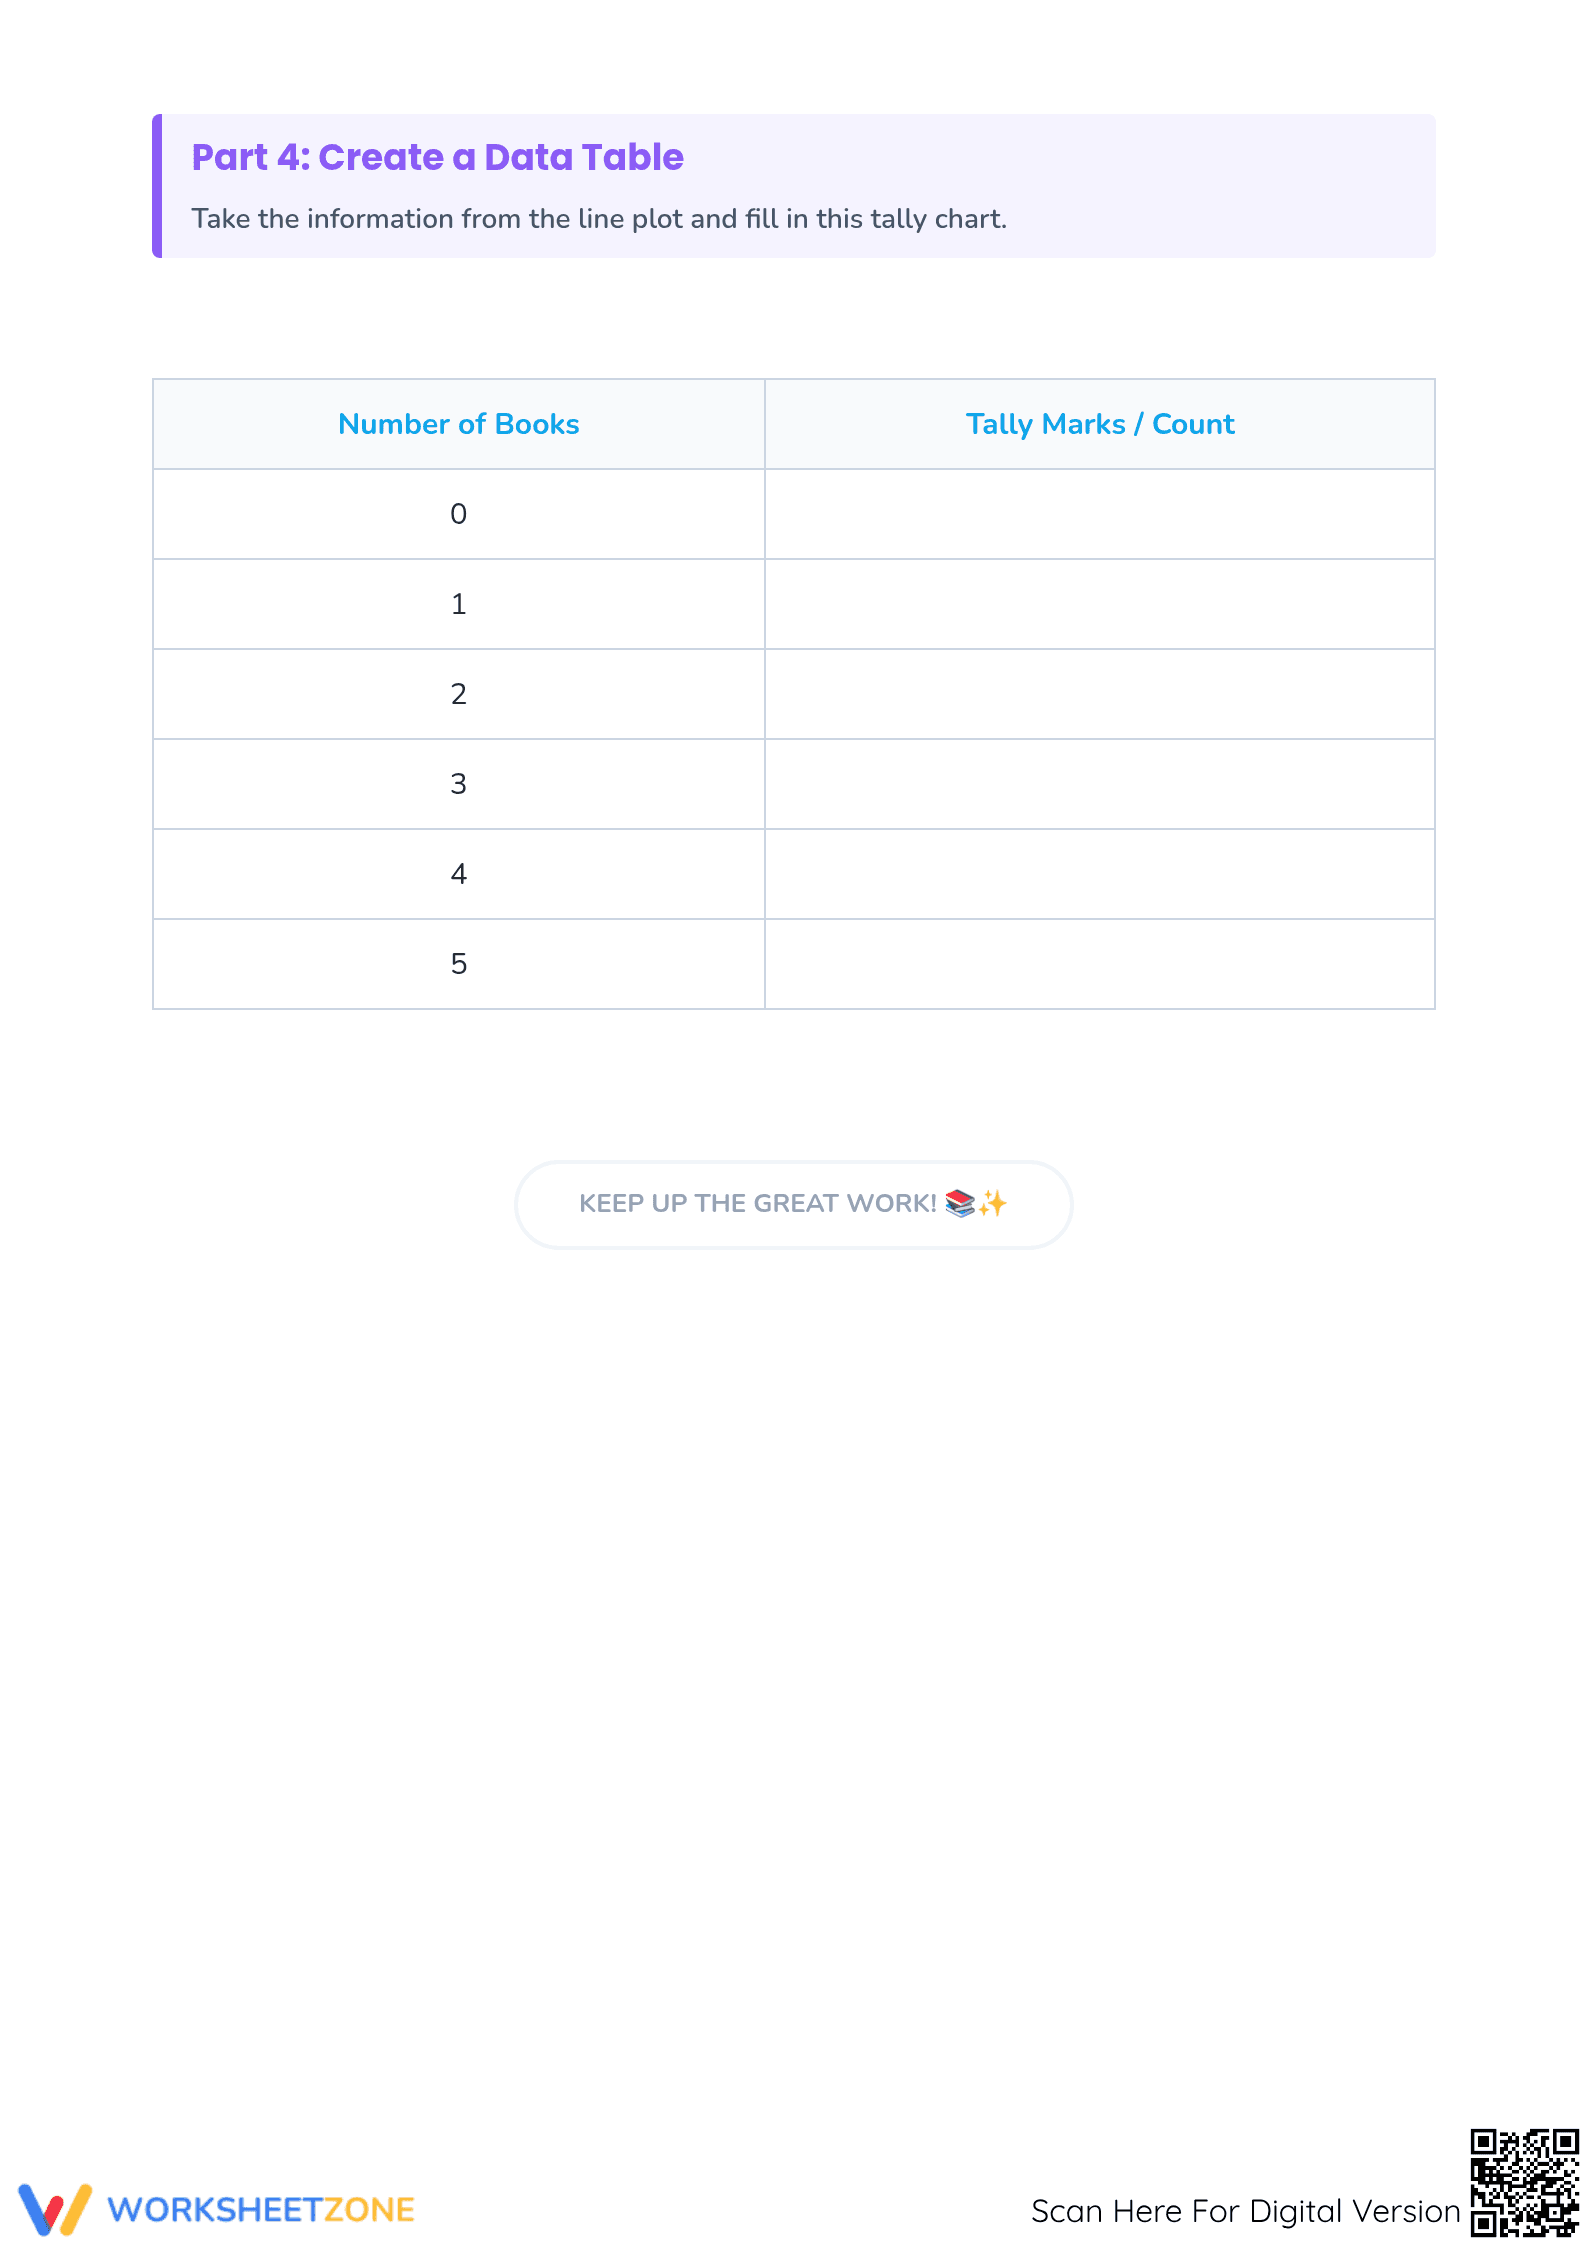
What's Inside: This 3-page PDF resource guides students through data representation. It features a detailed line plot (summer reading data), three slots for student-generated problem questions, three specific interpretation prompts regarding range and totals, and a tally chart for data conversion. An answer key is included for quick grading.
Skill Progression and Scaffolding
- Guided Practice: Students begin by studying a completed line plot, identifying the frequency of data points and understanding the horizontal scale. This initial observation phase ensures they can accurately read the provided measurement data before attempting complex analysis.
- Supported Analysis: In the second phase, students answer specific questions about the range and total participation. These 3 tasks bridge the gap between simple reading and high-level interpretation, focusing on mathematical operations derived from visual data.
- Independent Application: The final section requires students to create three original questions and construct a full tally table. This rigorous application phase confirms mastery by asking students to reorganize data into a new format, totaling 7 distinct learning interactions.
This resource follows a gradual-release model, moving from observation to teacher-supported interpretation and finally to independent data synthesis.
Standards Alignment
Primary Standard: 3.MD.B.4. This worksheet directly addresses the Grade 3 requirement to represent and interpret data using line plots. Students generate measurement data by counting frequencies and representing it in various formats, including tables. This standard code is suitable for lesson plans, IEP goals, or curriculum mapping.
How to Use It
Use this resource for independent practice or as a formative assessment after initial instruction on line plots. Observe students in Part 2 as they write questions; their ability to frame solvable questions indicates strong conceptual understanding. Expected completion time: 35 minutes.
Who It's For
Designed for Grade 3 general education students, this worksheet also supports RTI Tier 2 groups needing data visualization assistance. It complements anchor charts on graph types or hands-on lessons involving plotting measured objects.
Mastery of 3.MD.B.4 is crucial for early elementary math, laying the groundwork for fractions and statistics. EdReports 2024 highlights that high-quality data interpretation, requiring format conversion (line plots to tables), significantly boosts long-term retention. This worksheet fosters active analytical participation, engaging higher-order thinking as students formulate their own problems. Incorporating range and total calculations within line plots provides concrete arithmetic application, preparing students for advanced 4th and 5th-grade data standards. Educators can confidently use this 3-page set to demonstrate CCSS mastery.