


























Views
Downloads

4.MD.B.4 Printable Worksheet: Line Plots — Grade 4
Paste this activity's link or code into your existing LMS (Google Classroom, Canvas, Teams, Schoology, Moodle, etc.).
Students can open and work on the activity right away, with no student login required.
You'll still be able to track student progress and results from your teacher account.
This Grade 4 math worksheet provides targeted practice on creating and interpreting line plots, directly aligning with standard CCSS.MATH.CONTENT.4.MD.B.4. Students will use given data sets involving fractions to construct accurate line plots, then answer questions that require them to analyze the data they have displayed, reinforcing key data literacy skills.
At a Glance
- Grade: 4 · Subject: Math
- Standard:
CCSS.MATH.CONTENT.4.MD.B.4— Make a line plot to display a data set of measurements in fractions of a unit.- Skill Focus: Creating line plots with fractional data
- Format: 2 pages · 2 problems · Answer key included · PDF
- Best For: Independent practice, homework, or formative assessment
- Time: 20–30 minutes
What's Inside
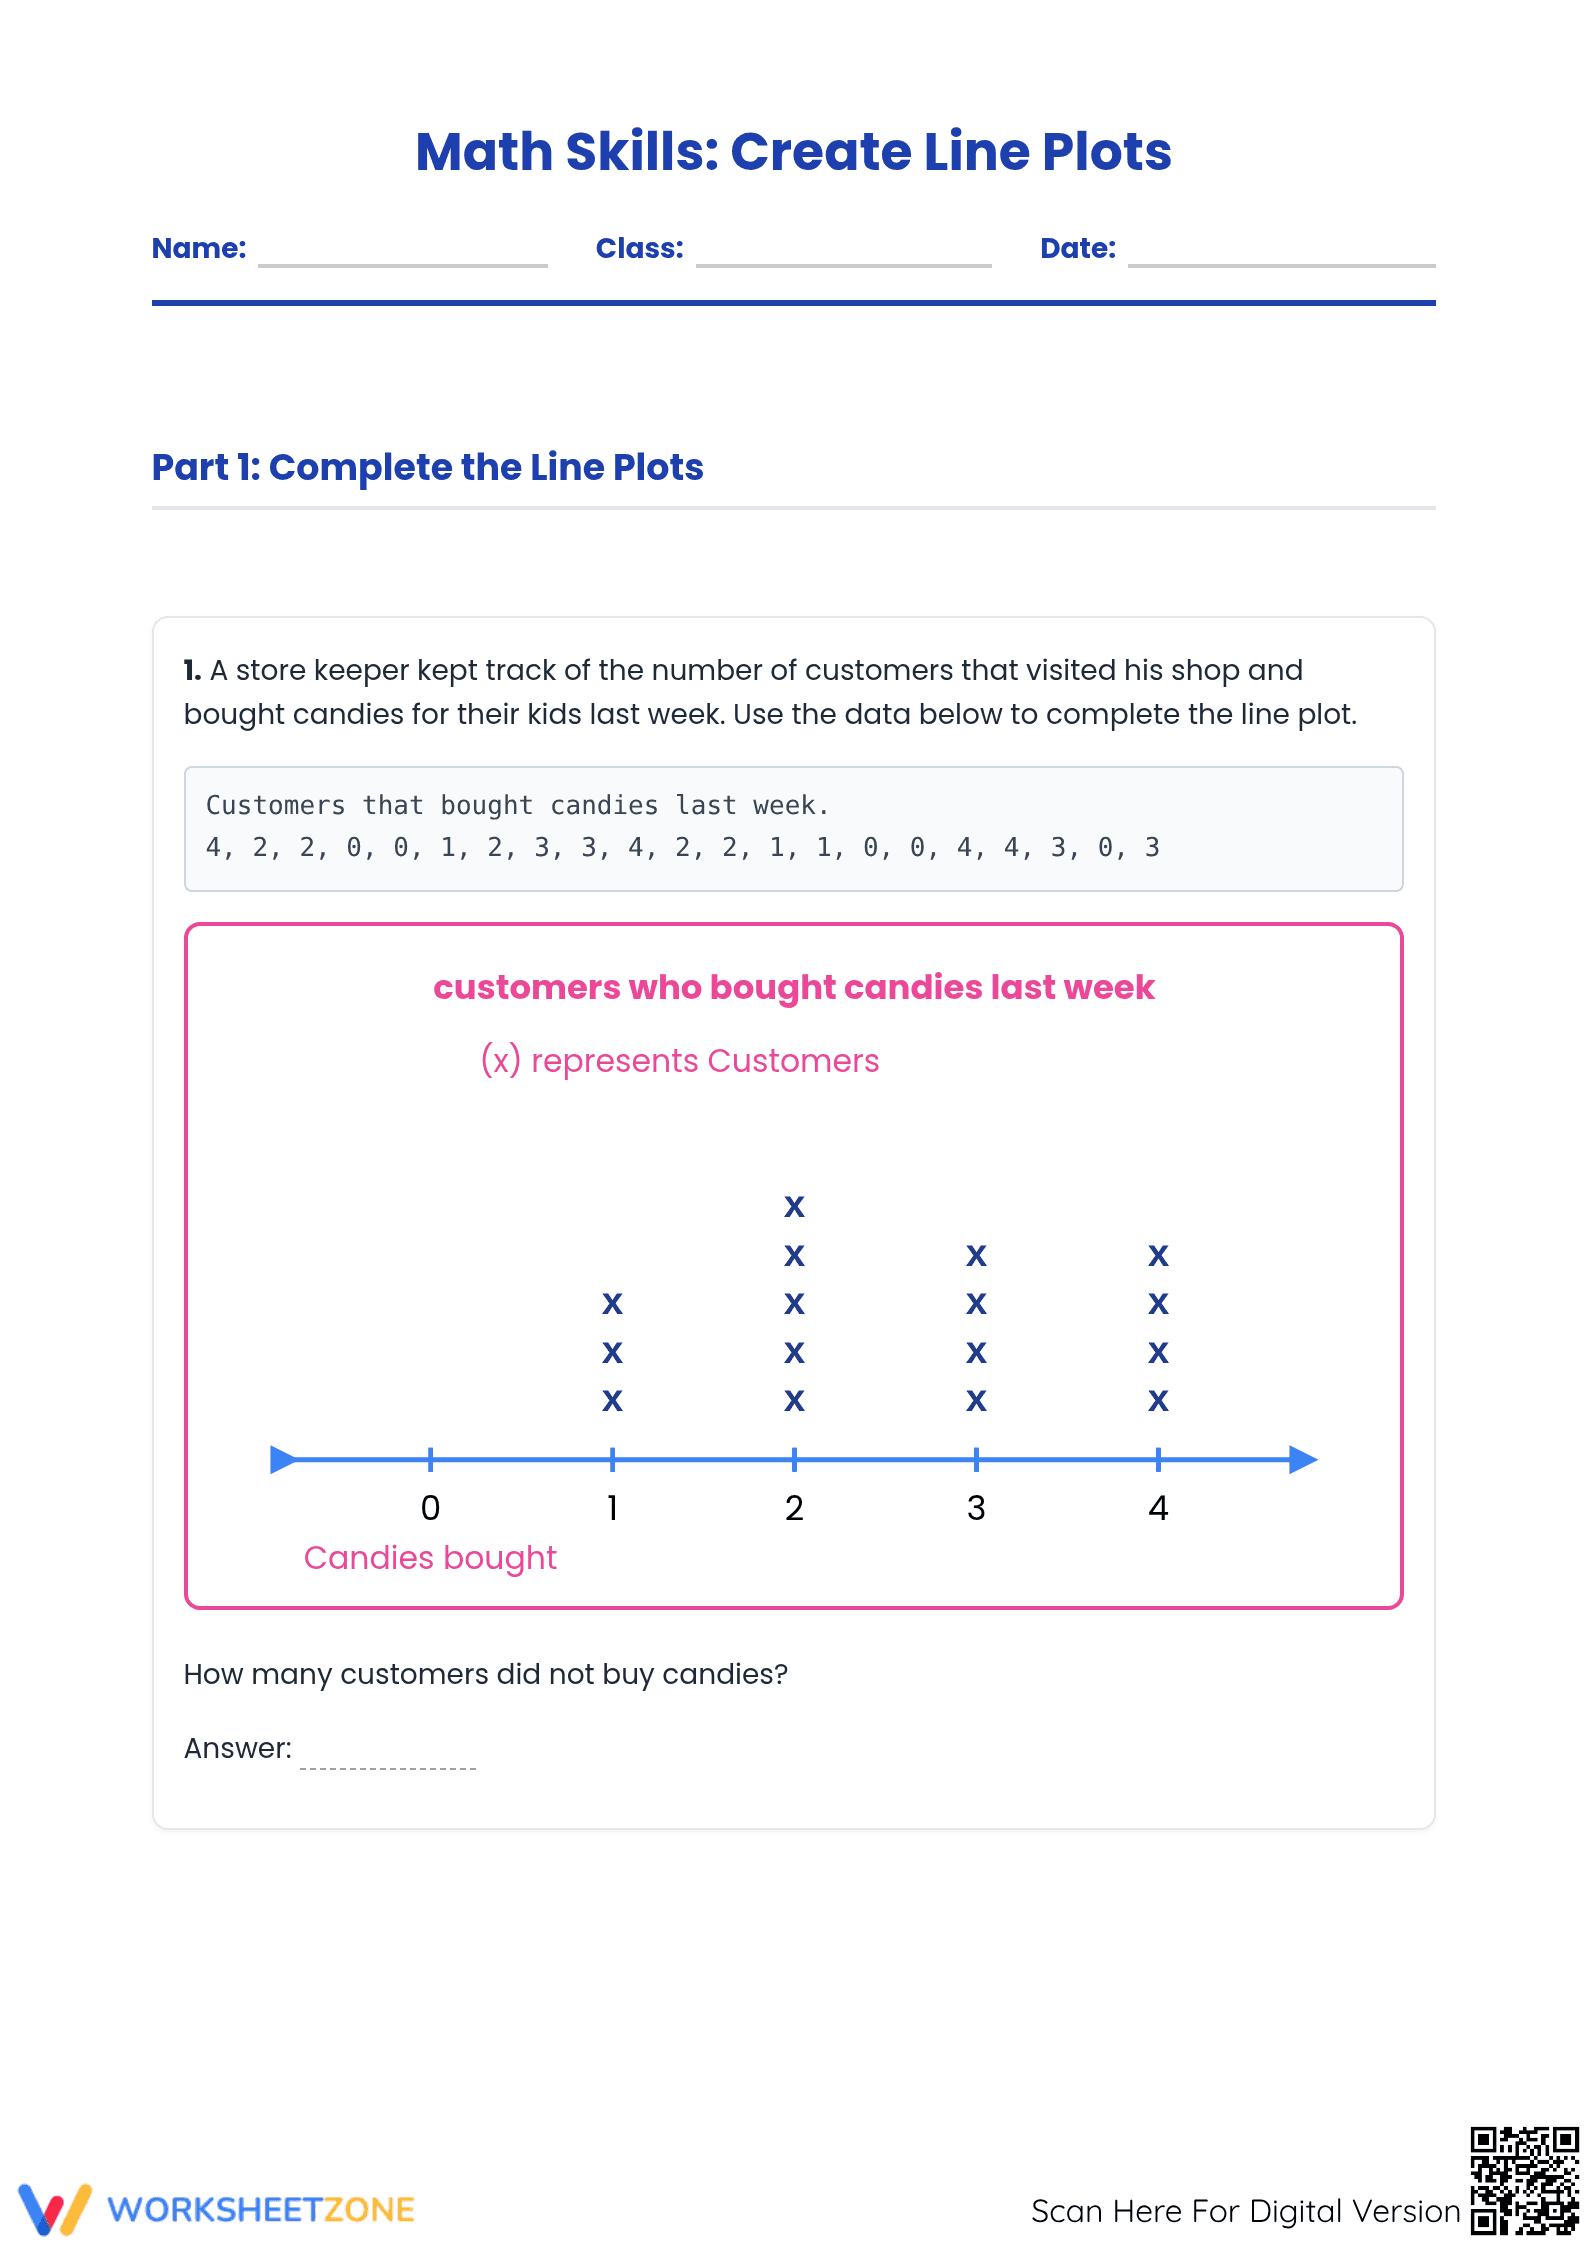
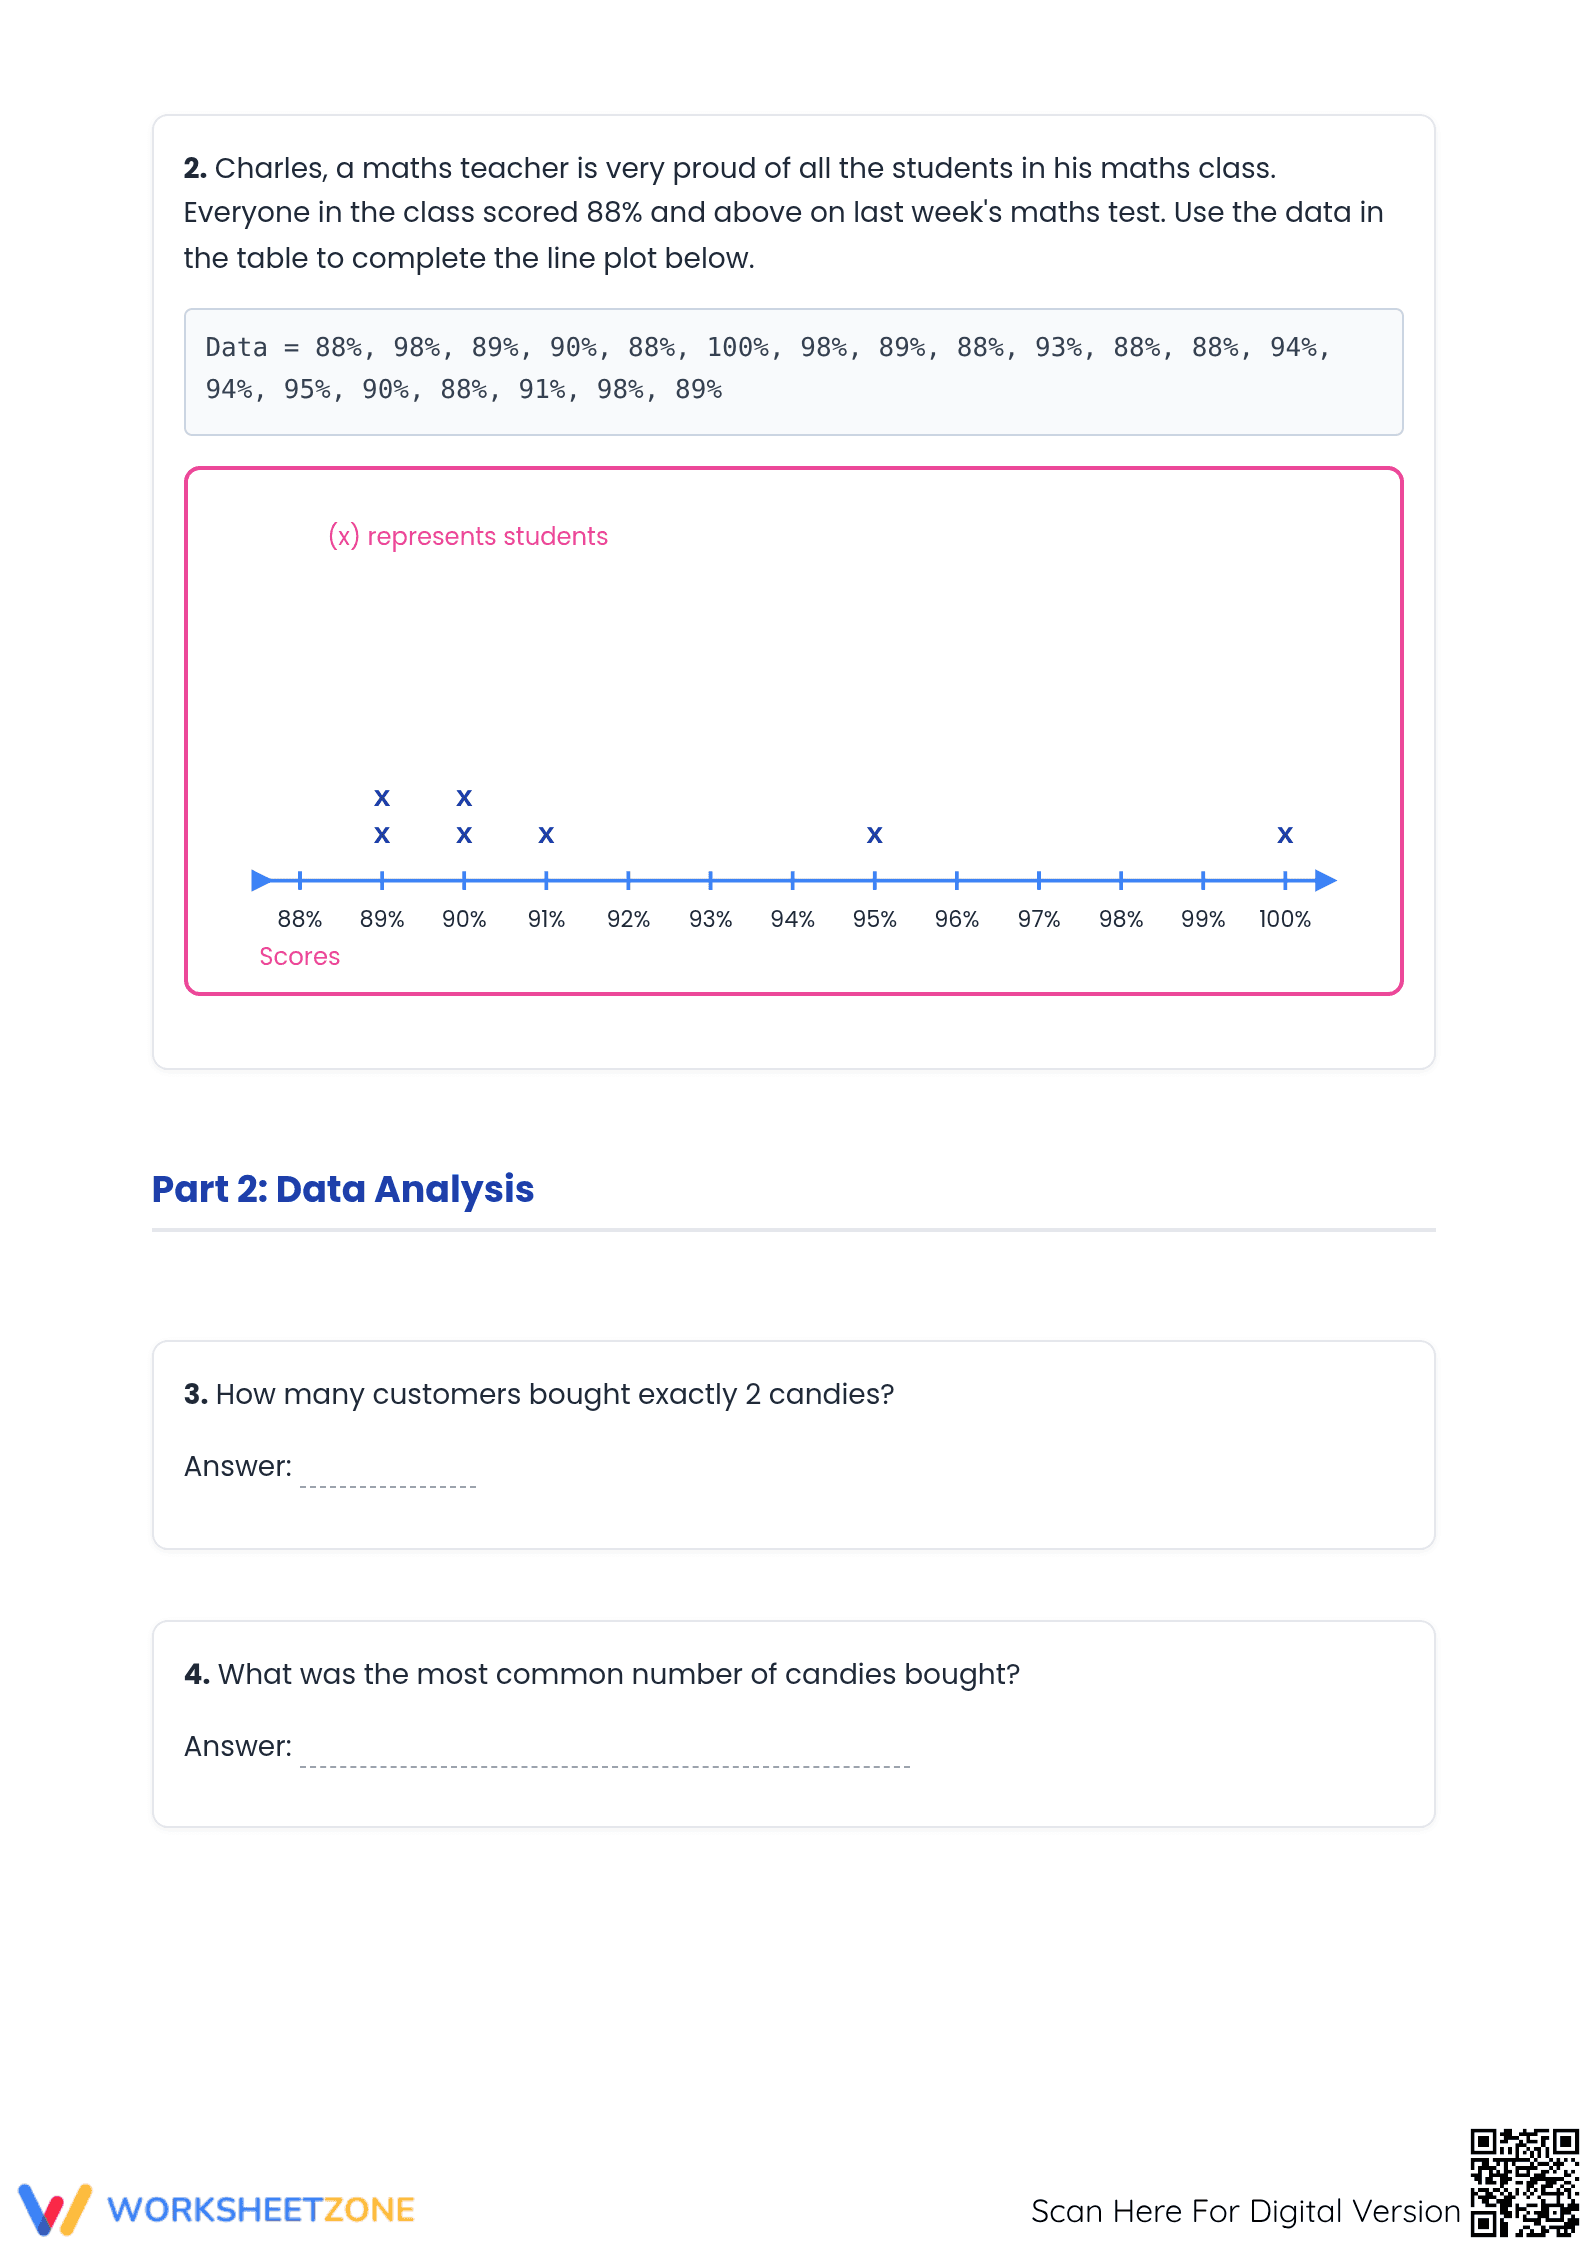
This resource contains two worksheet pages, each with a unique fractional data set. The first page features pencil lengths in fourths of an inch, and the second uses rainfall data in eighths. A full answer key showing the correct line plots and answers for both pages is included.
Mastery Evidence
This worksheet provides clear evidence of mastery for standard 4.MD.B.4. Though it lacks a formal rubric, the tasks directly assess core skills. The first step on each page measures the ability to plot fractional data. Subsequent questions test data interpretation through calculations and analysis. Teachers can use student performance on these parts to identify specific misunderstandings, making it a strong tool for formative assessment. The alignment allows for easy entry of performance data into standards-based gradebooks.
Standards Alignment
This worksheet aligns with Grade 4 standard CCSS.MATH.CONTENT.4.MD.B.4, which requires students to create line plots with fractional data and solve problems using them. It also supports CCSS.MATH.CONTENT.4.NF.B.3.D (solving word problems with fraction addition/subtraction). Both standard codes can be copied directly into lesson plans or curriculum maps.
How to Use It
Use this worksheet for independent practice after a lesson on line plots or assign it as homework. It also functions as a formative assessment. After students complete the first page (about 10-15 minutes), observe their work, checking for correct 'X' placement. The full worksheet takes about 20-30 minutes, fitting easily into a single math block.
Who It's For
This resource is for 4th-grade students learning data representation with fractions. For students needing support, review vocabulary and how to create fractional number lines beforehand. It pairs well with a hands-on activity where students generate their own data before using this resource for structured practice.
Effectively representing data is a critical mathematical practice, and this worksheet provides focused practice on standard CCSS.MATH.CONTENT.4.MD.B.4. By requiring students to make a line plot with fractional units, it bridges the key domains of Measurement & Data and Number & Operations—Fractions. Research from RAND AIRS 2024 emphasizes the importance of procedural fluency built upon conceptual understanding. This resource supports that by moving students from the concrete data table to a visual representation, then prompting them to use that representation to solve problems. The ability to not just create a graph but to use it for analysis is a foundational skill for statistical literacy. This worksheet offers a standards-aligned method for building that capacity in Grade 4 students, providing measurable evidence of their ability to work with data presented in a common format.


