


Views
Downloads
Essential Line Plots Worksheet: Grade 5 Fractions & Data
Paste this activity's link or code into your existing LMS (Google Classroom, Canvas, Teams, Schoology, Moodle, etc.).
Students can open and work on the activity right away, with no student login required.
You'll still be able to track student progress and results from your teacher account.
This Grade 5 line plots worksheet provides a collaborative framework for students to master data representation and analysis using fractional measurements. By working in pairs to bridge information gaps, learners develop essential communication skills while performing complex calculations involving total sums and the redistribution of data points to find a fair share.
At a Glance
- Grade: 5 · Subject: Math
- Standard:
5.MD.B.2— Make line plots with fractional measurements and solve problems involving data redistribution- Skill Focus: Line plots with fractions
- Format: 3 pages · 6 problems · Answer key included · PDF
- Best For: Collaborative partner practice and data analysis
- Time: 25–35 minutes
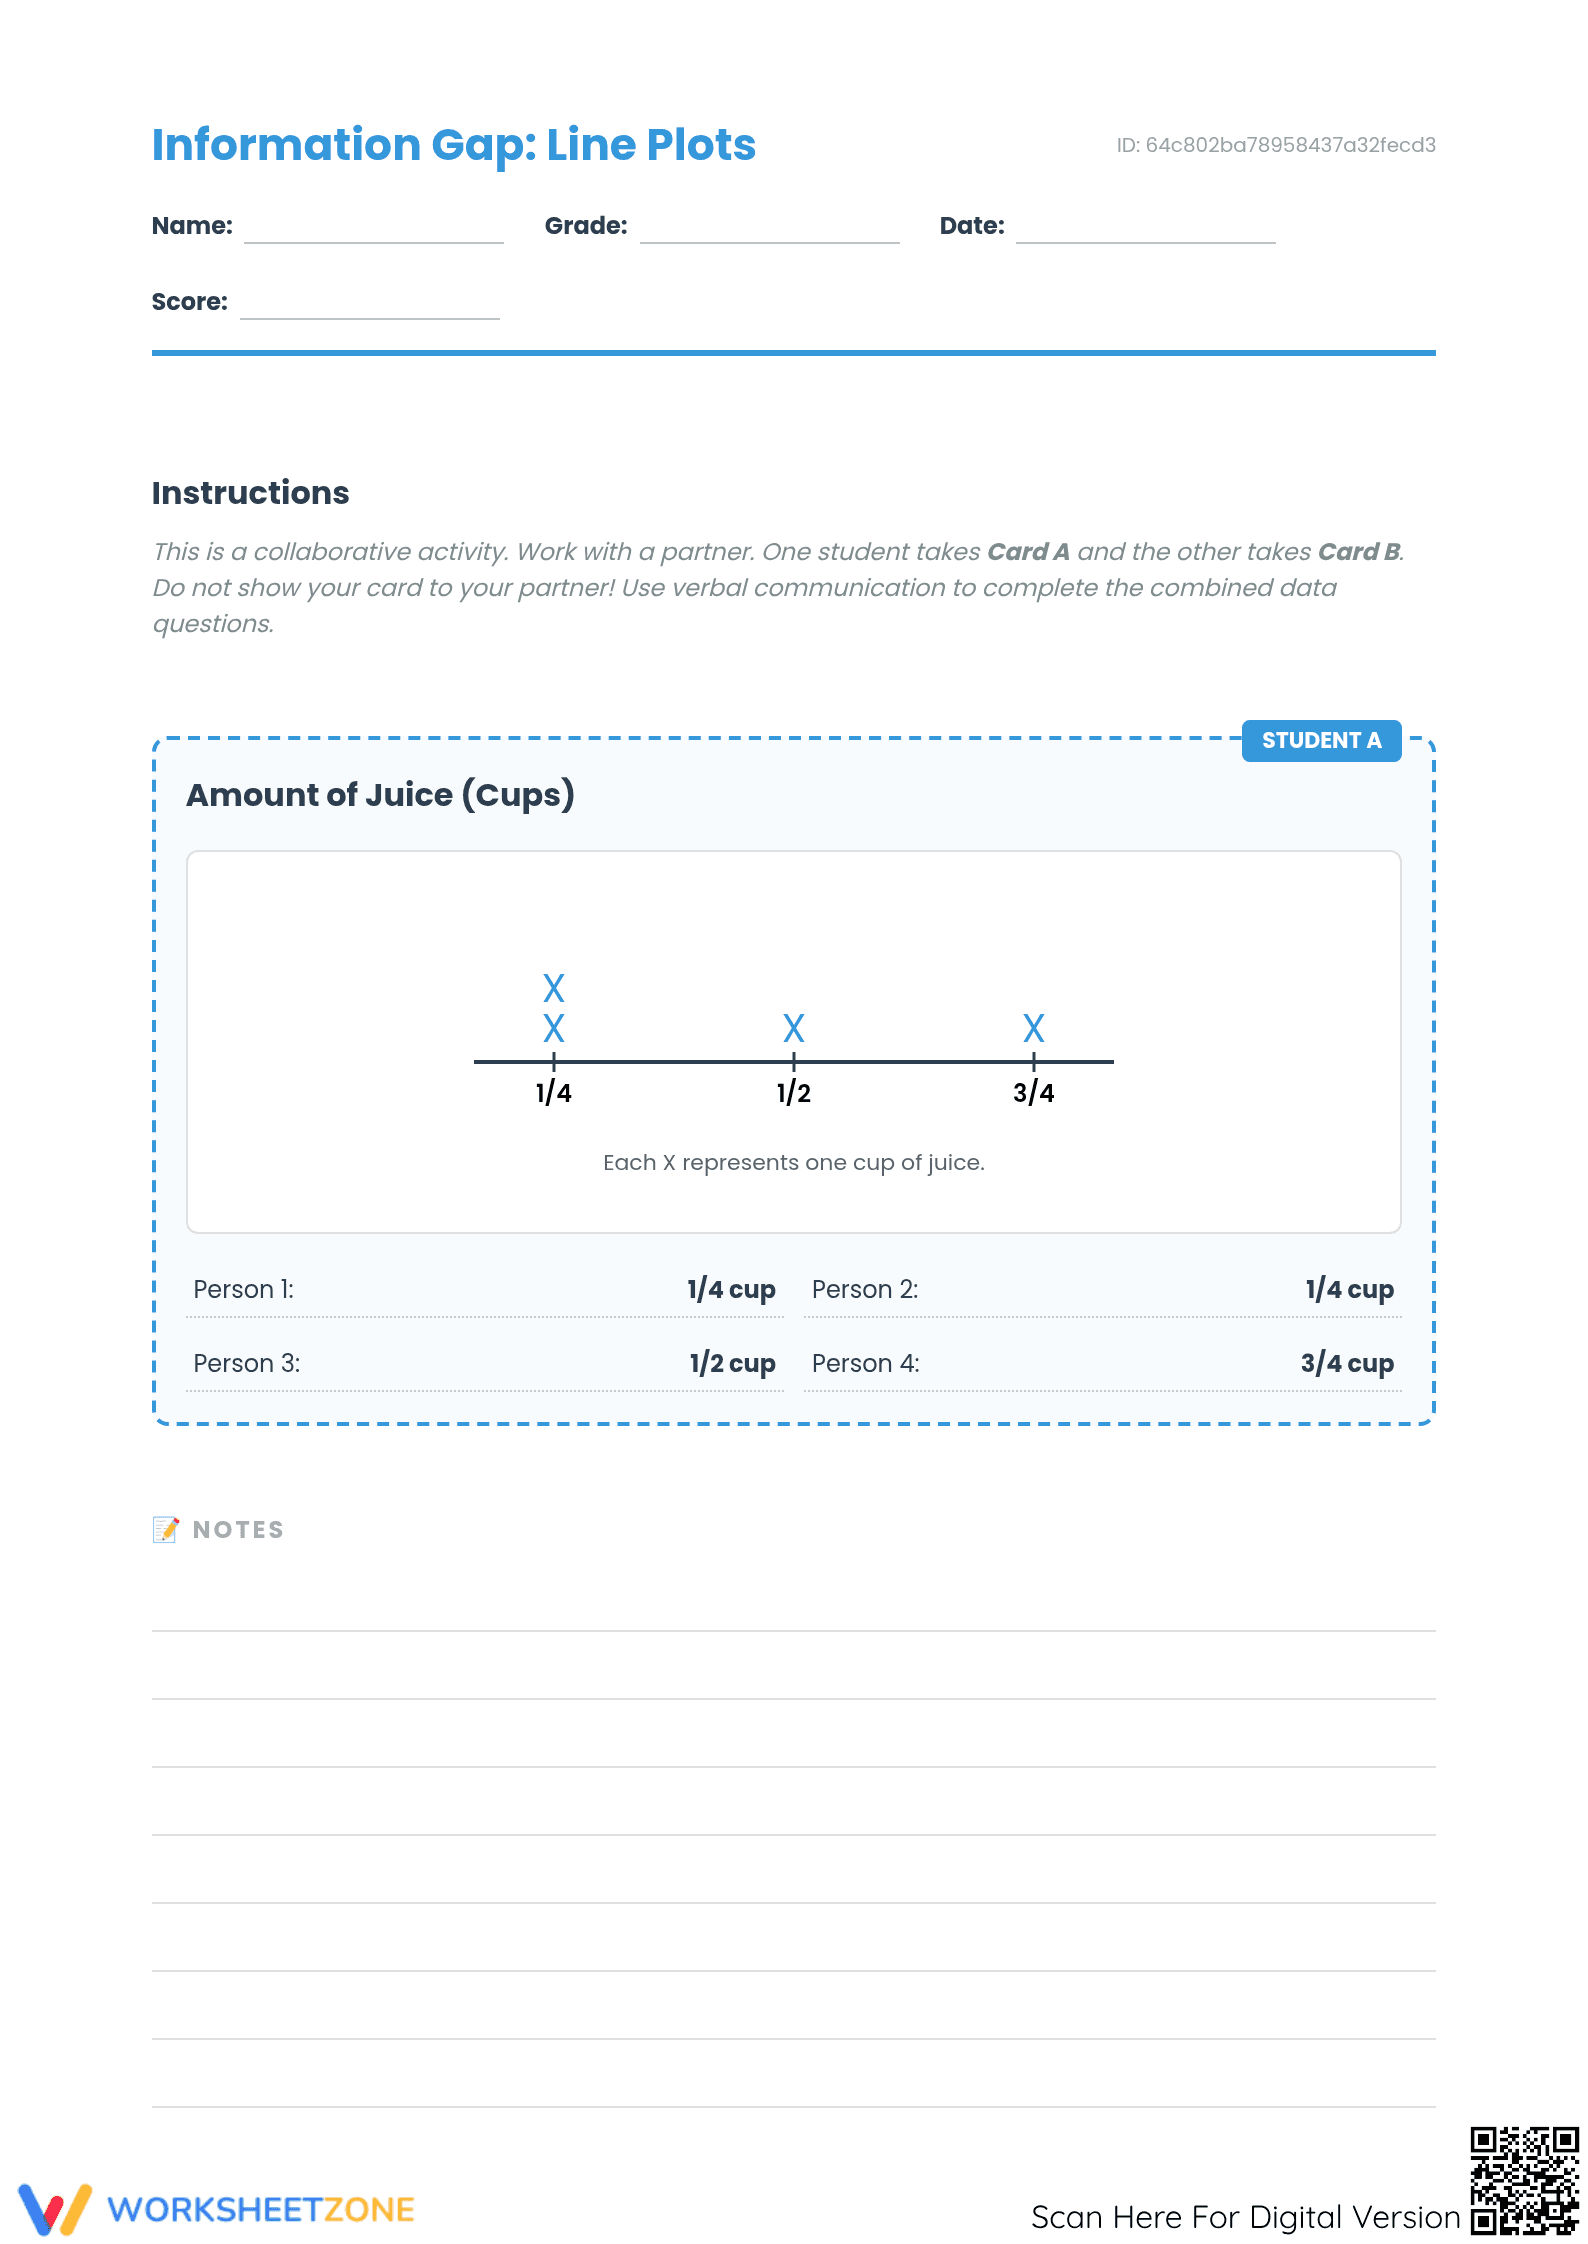
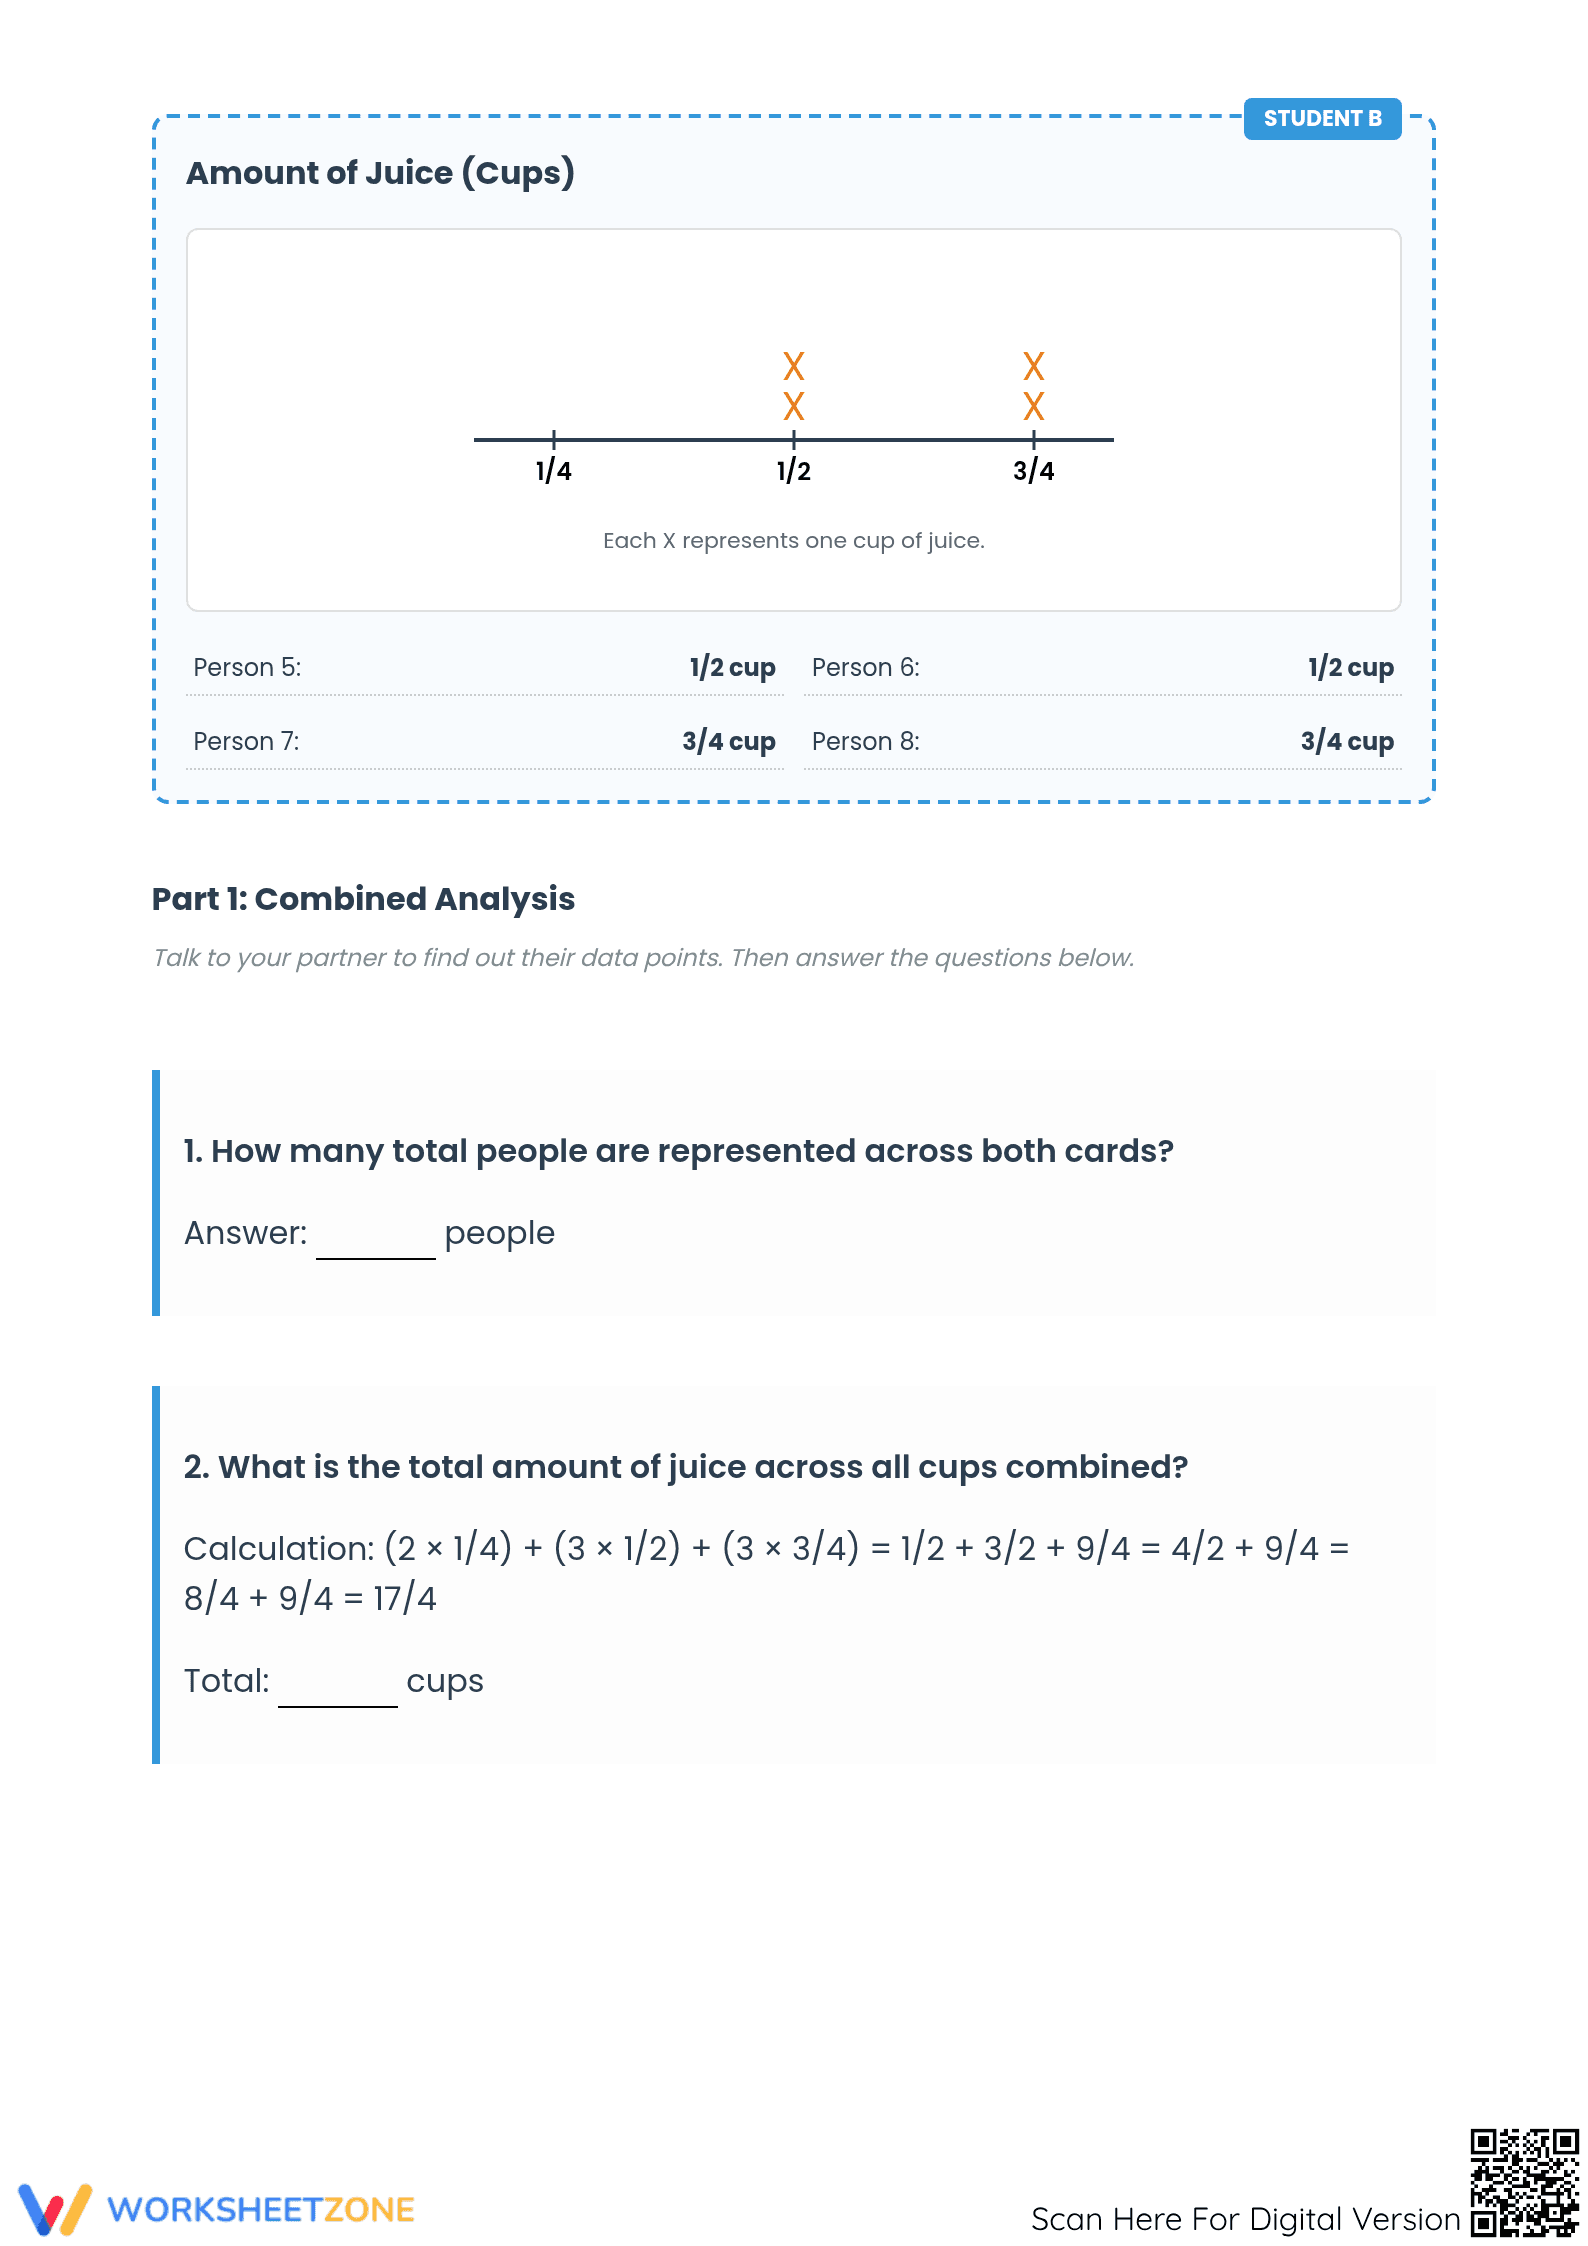
Inside this three-page resource, you will find two distinct information cards labeled Student A and Student B, each containing unique data sets represented on partial line plots. The packet includes a structured combined analysis section where students must pool their data to solve six progressively difficult problems, a master plotting area, and a comprehensive answer key for immediate feedback.
Skill Progression
- Guided Data Sharing: Students verbally communicate four data points from individual cards to complete a shared table, reinforcing mathematical precision.
- Supported Analysis: Using eight combined measurements, learners solve guided problems requiring fraction addition and division to find totals and averages.
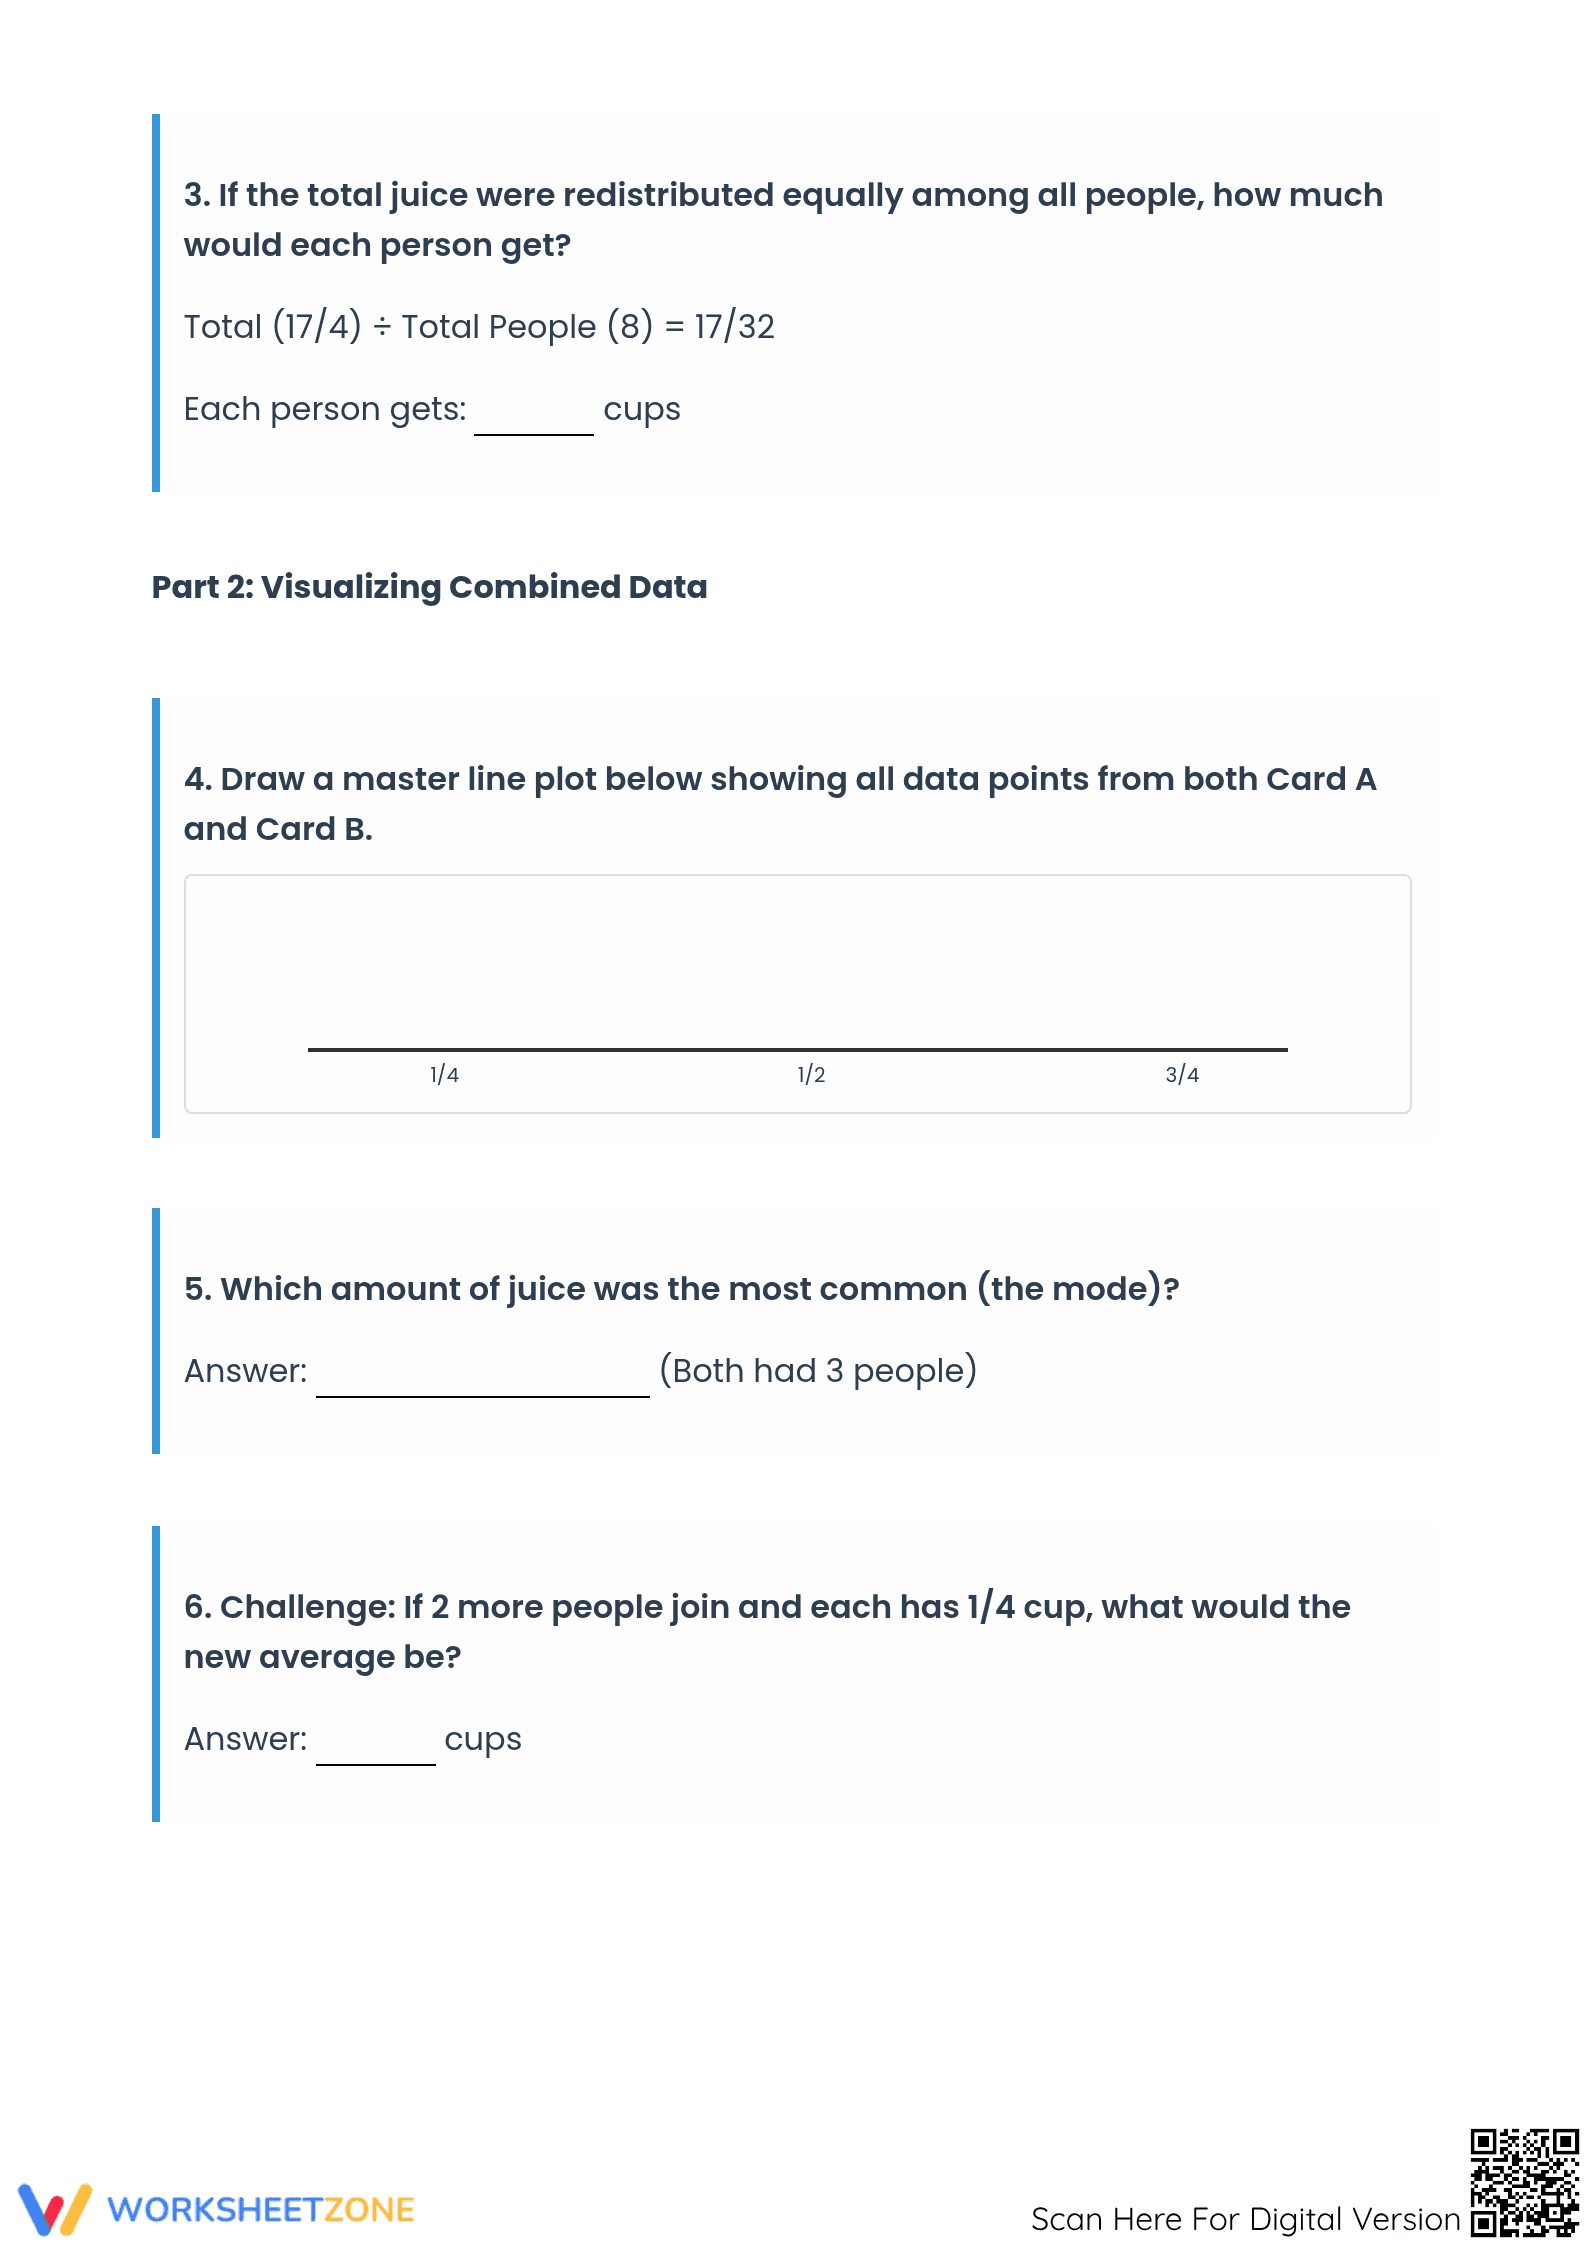
- Independent Visualization: Students synthesize information by constructing a master line plot, demonstrating mastery of scale and data density.
This sequence moves from collaborative discovery to independent verification of statistical concepts.
Standards Alignment
This worksheet is primarily aligned with 5.MD.B.2: "Make a line plot to display a data set of measurements in fractions of a unit (1/2, 1/4, 1/8). Use operations on fractions for this grade to solve problems involving information presented in line plots." It also supports foundational fraction addition and division skills. Both standard codes can be copied directly into lesson plans, IEP goals, or district curriculum mapping tools.
How to Use It
Use this during the guided practice phase of a measurement lesson. It works well as a math center or collaborative partner activity. For a formative assessment observation, check the fair share calculation in Question 3; successful students divide the total sum by the count of data points. Completion takes 25 to 35 minutes.
Who It's For
This resource is designed for Grade 5 students working toward mastery of measurement standards. It can be used as an enrichment activity for Grade 4 learners who are advanced in fraction addition, or as a remediation tool for Grade 6 students needing to review the relationship between line plots and averages. It pairs naturally with an anchor chart on fraction equivalence or a direct instruction lesson on measurement scales.
According to Fisher & Frey (2014) in their research on the gradual release of responsibility, collaborative tasks like this information gap activity are vital for developing mathematical discourse and peer-to-peer reasoning. This worksheet specifically addresses the 5.MD.B.2 standard, requiring students to synthesize data points from two different sources into a single master line plot. By calculating the "fair share" or average through fraction division, learners move beyond simple data retrieval into higher-order statistical analysis. The structured nature of the activity ensures that every student must actively communicate their findings to their partner, reinforcing the vocabulary of numerators and denominators in a functional context. This approach aligns with NAEP recommendations for increasing data literacy in the middle grades by providing authentic opportunities to manipulate and redistribute measurements. Such integrated practice helps cement the relationship between algebraic operations and visual data representation, preparing students for more complex statistical modeling in later grades.