


0
Views
0
Downloads
0.0
0
Save
0 Likes
Linear Function Graphing Practice - Slope & Y-Intercept Math
0 Views
0 Downloads
Paste this activity's link or code into your existing LMS (Google Classroom, Canvas, Teams, Schoology, Moodle, etc.).
Students can open and work on the activity right away, with no student login required.
You'll still be able to track student progress and results from your teacher account.
Information
Description
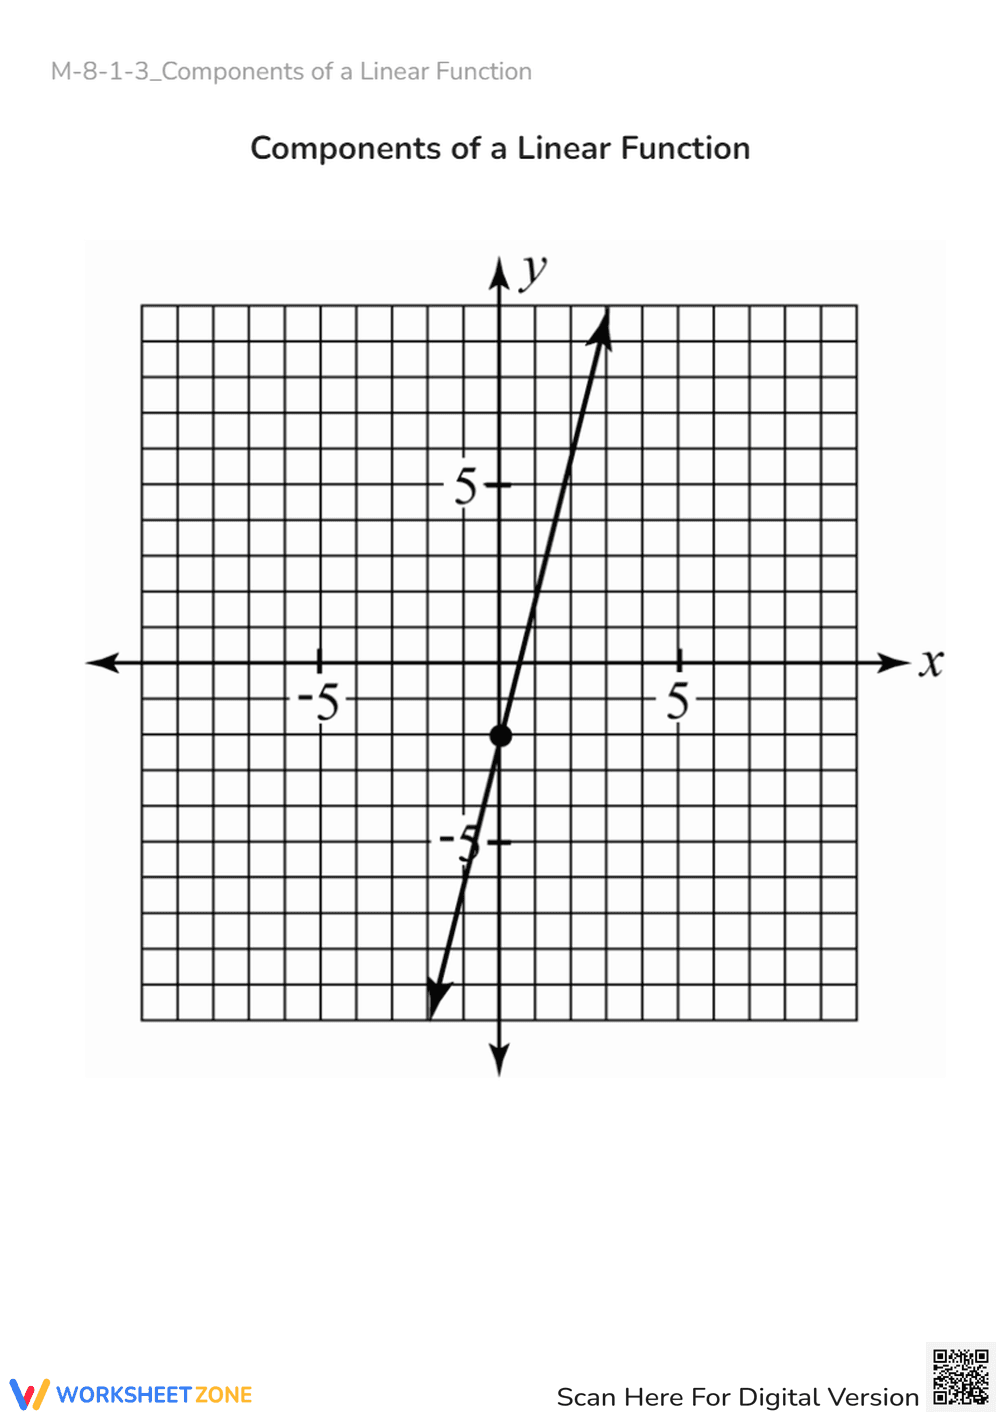
What It Is:
This is a math worksheet titled 'Components of a Linear Function.' It features a graph with x and y axes, numbered from -5 to 5 on each axis. A straight line is plotted on the graph, intersecting the y-axis at approximately -1 and passing through the origin. A point is marked on the line.
Grade Level Suitability:
This worksheet is suitable for grades 8-9. It focuses on understanding linear functions and their graphical representation, which are key concepts in pre-algebra and algebra courses.
Why Use It:
This worksheet helps students visualize linear functions and understand the relationship between the equation of a line and its graph. It can be used to reinforce concepts like slope, y-intercept, and identifying points on a line.
How to Use It:
Use this worksheet to identify the y-intercept of the line. Students can also determine the slope of the line from the graph. It can also be used to practice plotting points and creating the equation of the line.
Target Users:
This worksheet is ideal for students learning about linear functions in algebra. It can also be helpful for teachers looking for visual aids to explain these concepts.