What It Is:
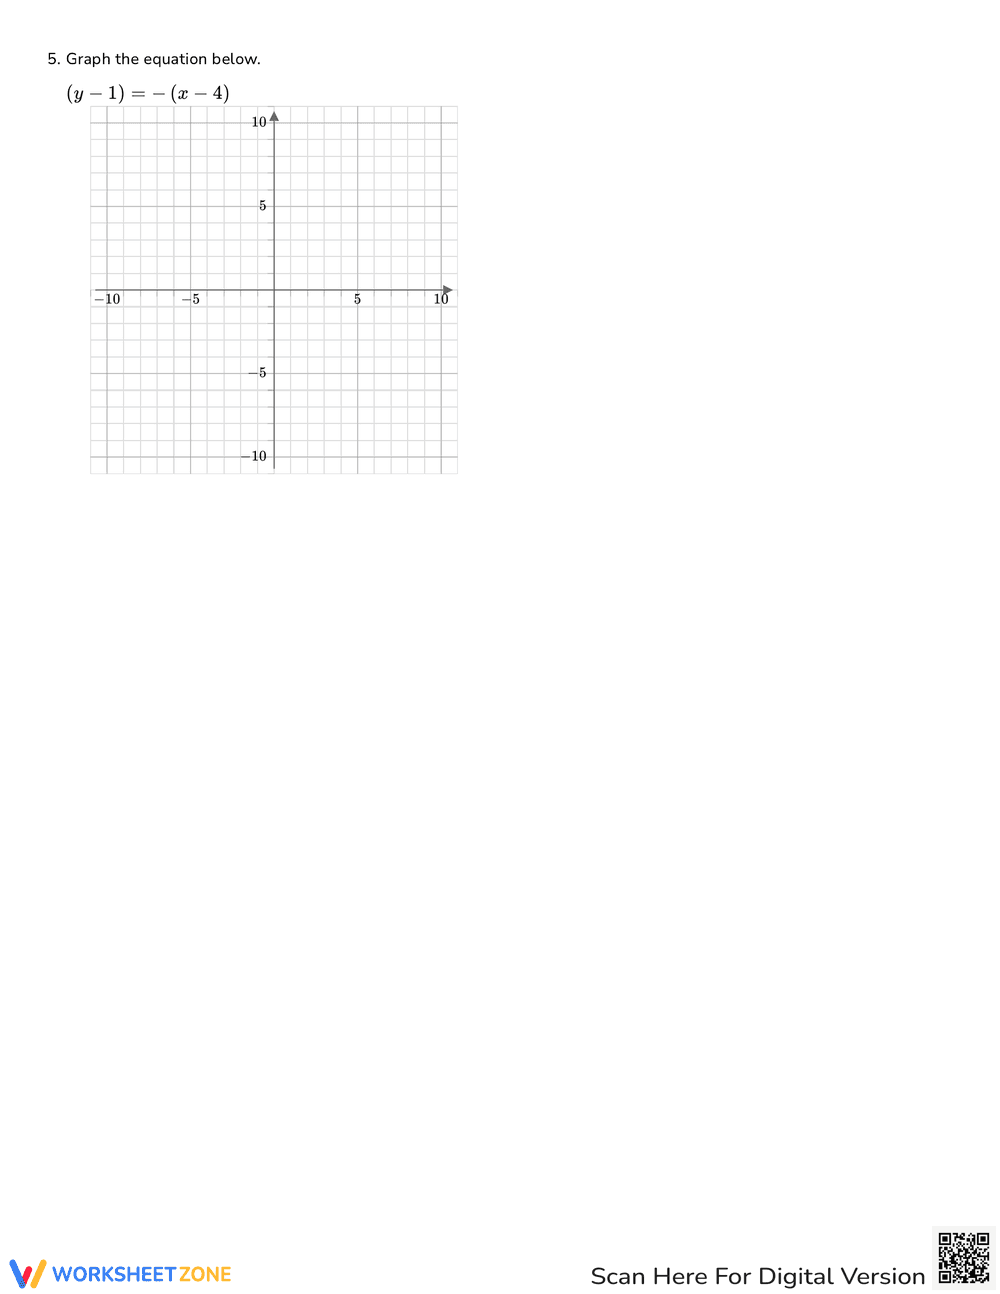
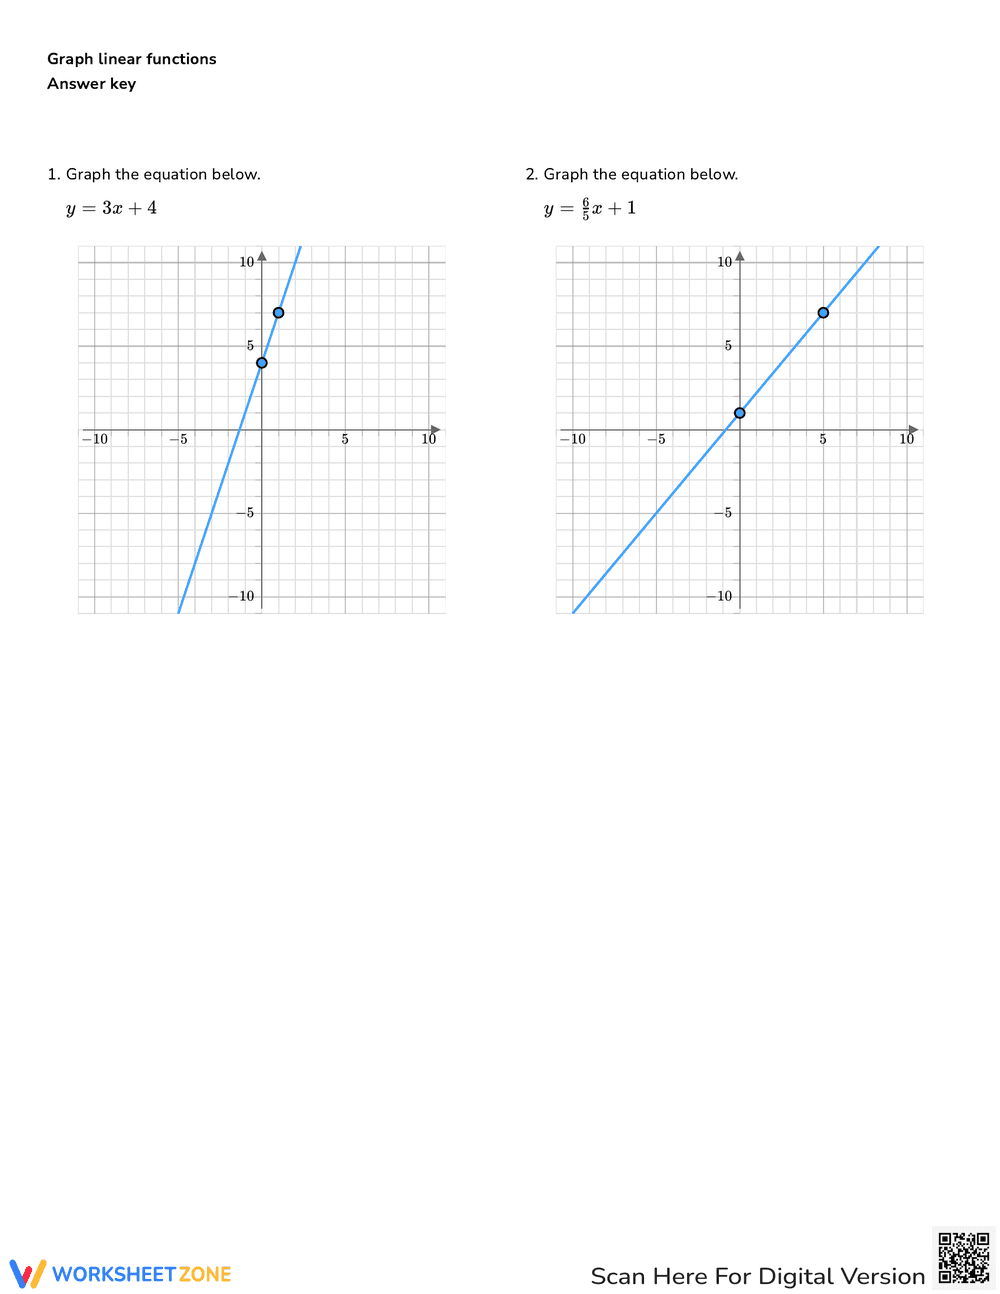
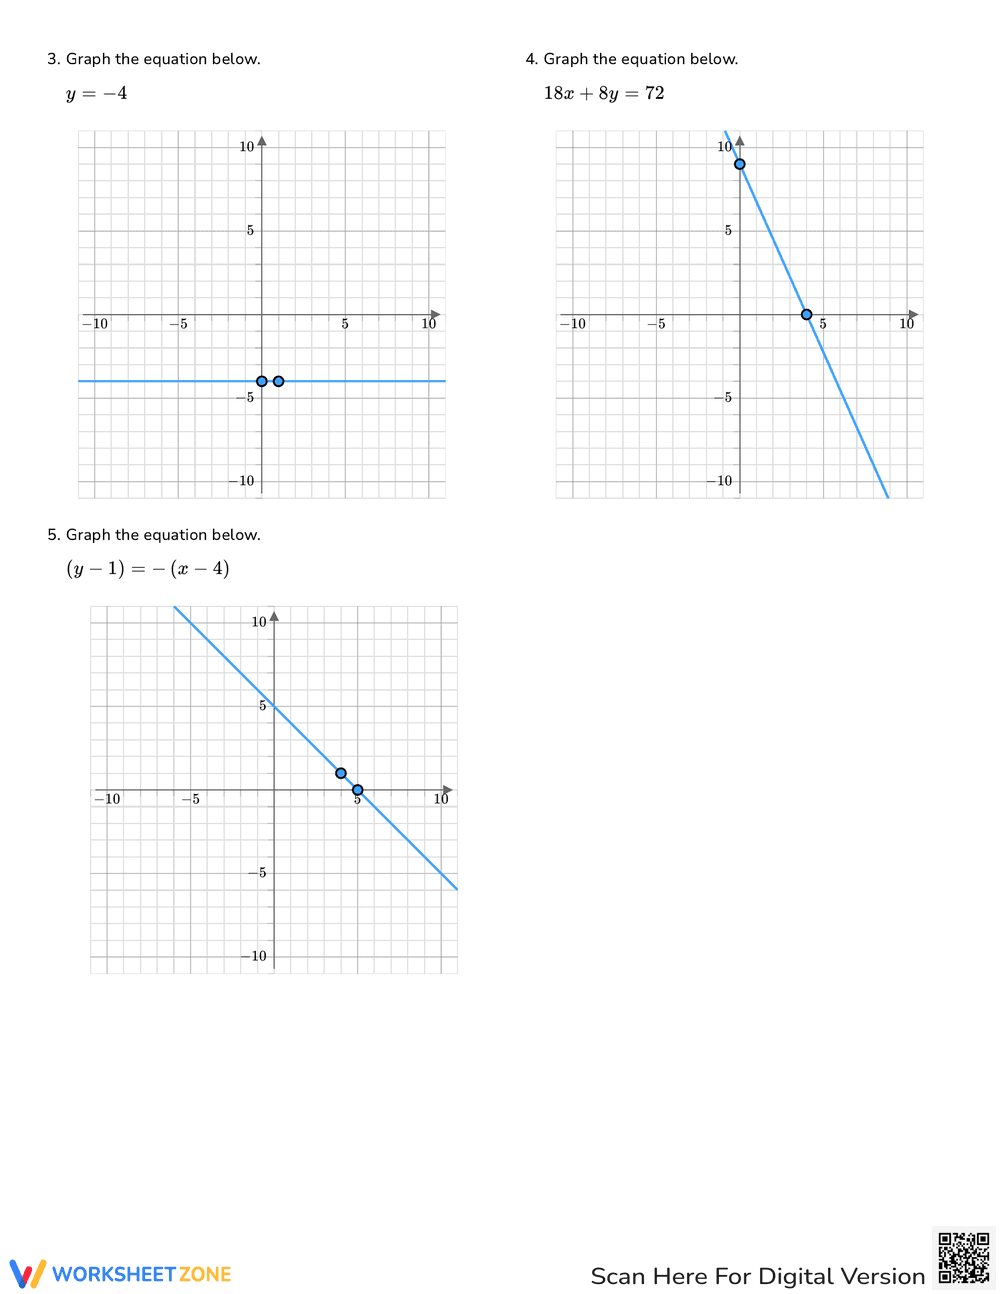
This is a math worksheet focusing on graphing linear functions. It includes four problems where students are asked to graph given equations on a coordinate plane. The equations are in various forms, including slope-intercept form (y = 3x + 4, y = 1/2x + 1), a horizontal line (y = -4), and a standard form equation (18x + 8y = 72). Each problem has a pre-drawn coordinate plane ranging from -10 to 10 on both the x and y axes. The worksheet also has fields for Name, Date, and Period.
Grade Level Suitability:
This worksheet is suitable for grades 8-10, specifically Algebra 1. It requires students to understand and apply concepts like slope, y-intercept, and how to transform equations into a graph. The presence of an equation in standard form makes it more appropriate for higher grades within that range.
Why Use It:
This worksheet provides practice in graphing linear equations. It helps students develop their understanding of the relationship between equations and their graphical representation. It reinforces skills in identifying slope and y-intercept and converting equations into a visual format. It also helps students understand horizontal lines and converting equations from standard form.
How to Use It:
Students should first analyze each equation to determine its slope and y-intercept (or other relevant characteristics). Then, they should plot points on the coordinate plane based on the equation and draw a line connecting those points. For the standard form equation, students may need to convert it to slope-intercept form first.
Target Users:
The target users are students in Algebra 1 or pre-algebra courses who are learning about graphing linear equations. It's also suitable for students needing review or extra practice on this topic. It can be used by teachers for in-class assignments, homework, or assessments.