


1 / 2
0
Views
0
Downloads
0.0
0
Save
0 Likes
Interpreting Slope and Intercept
0 Views
0 Downloads
Paste this activity's link or code into your existing LMS (Google Classroom, Canvas, Teams, Schoology, Moodle, etc.).
Students can open and work on the activity right away, with no student login required.
You'll still be able to track student progress and results from your teacher account.
Information
Description
What It Is:
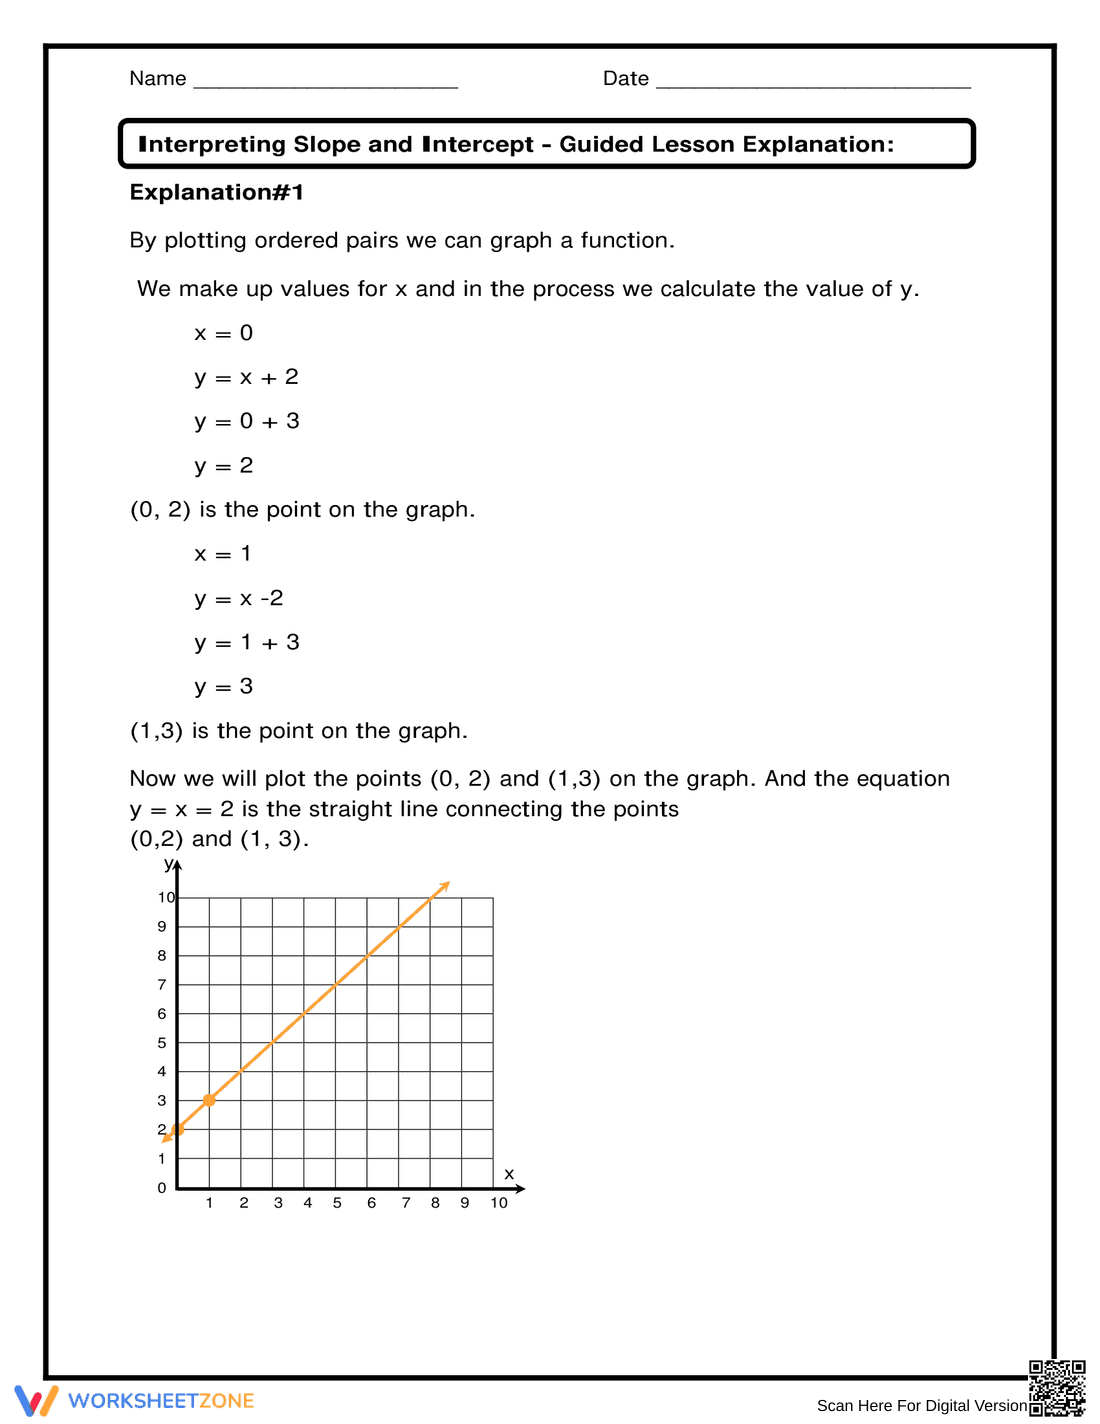
This is an educational worksheet titled 'Interpreting Slope and Intercept - Guided Lesson Explanation.' It provides a step-by-step example of how to graph a linear function by plotting ordered pairs. The worksheet shows how to calculate the value of y for given x values (x=0 and x=1) using the equation y = x + 2. It then plots the points (0,2) and (1,3) on a coordinate plane and draws the line connecting them.
Grade Level Suitability:
This worksheet is suitable for grades 7-9. It introduces the concept of graphing linear equations, which is typically taught in middle school math. The guided explanation makes it appropriate for students who are just beginning to learn about slope and intercept.
Why Use It:
This worksheet helps students understand the relationship between an equation and its graph. It provides a visual representation of how to plot points and draw a line. It also helps students to understand how to calculate the value of y for a given x value in a linear equation, reinforcing the concept of a function.
How to Use It:
Students can follow the step-by-step explanation to understand how to graph a linear equation. They can then use the example as a guide to graph other equations. The worksheet can be used as a classroom activity, homework assignment, or as a self-study tool.
Target Users:
The target users are middle school students learning about graphing linear equations. It is also suitable for teachers who need a simple and clear example to explain the concept of slope and intercept. It can also be useful for homeschoolers.