These 2nd grade graphing data worksheets pdf give teachers targeted, printable practice for one of the more underappreciated transitions in early elementary math — the move from counting isolated objects to drawing conclusions from organized data. The mechanics of coloring bars and placing icons are accessible to most second graders, but the real instructional work lies in getting students to read what a finished graph actually tells them.
The Specific Skills Each Worksheet Targets
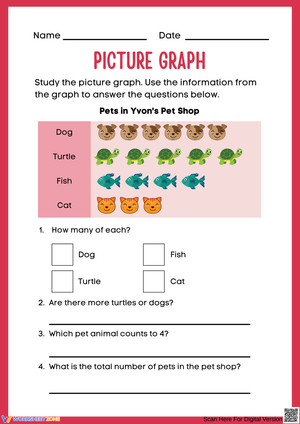
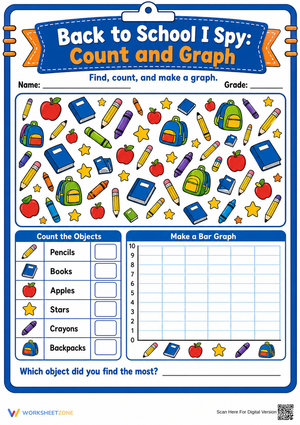
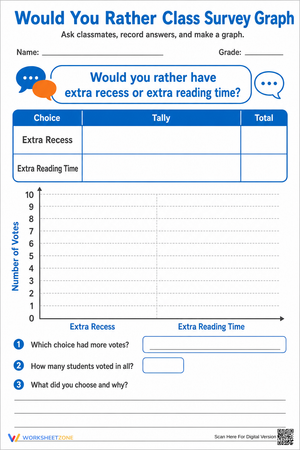
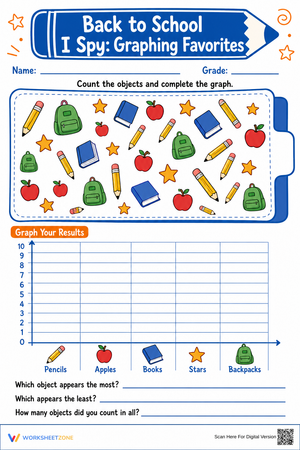
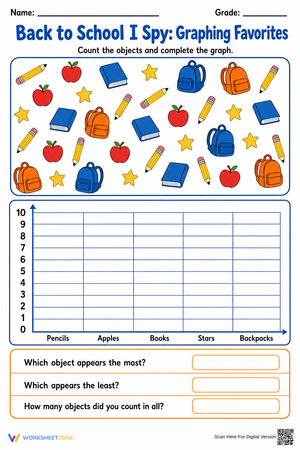
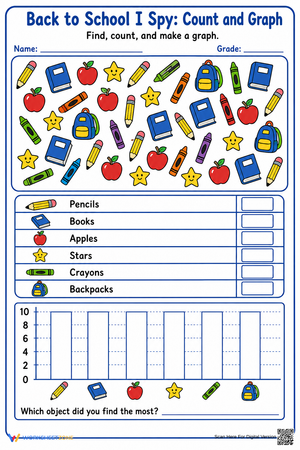
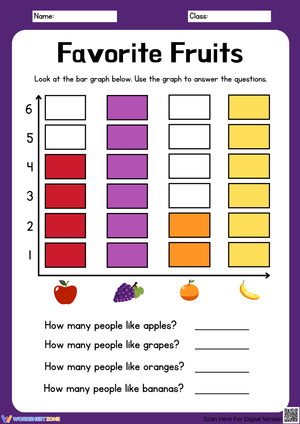
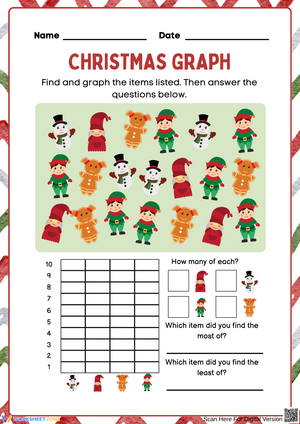
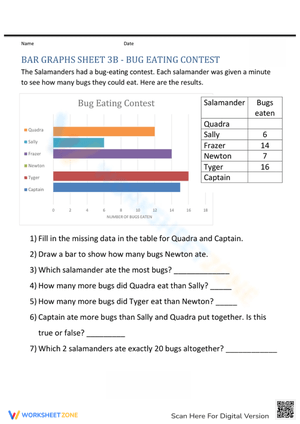
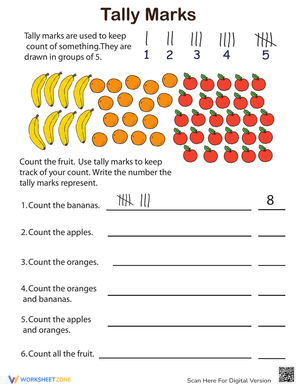
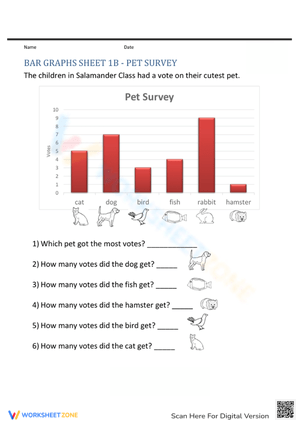
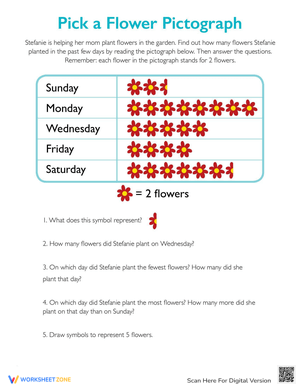
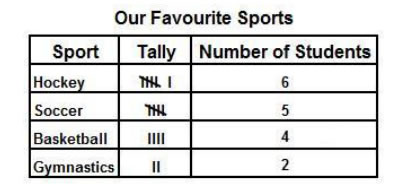
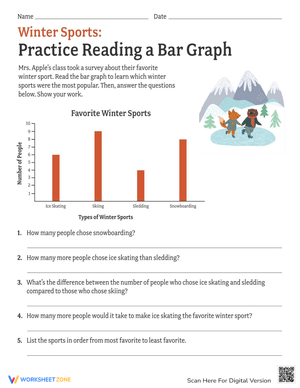
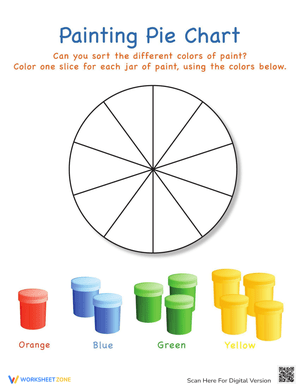
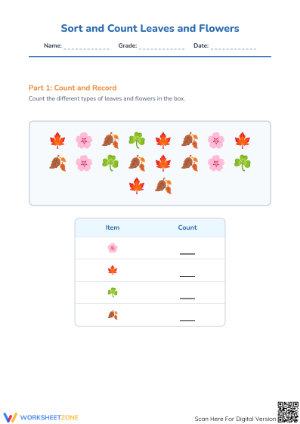
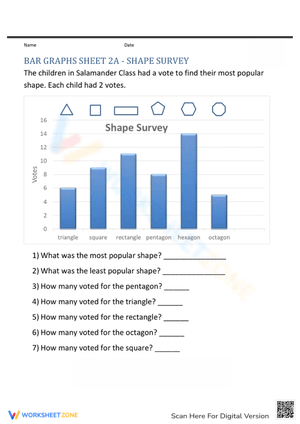
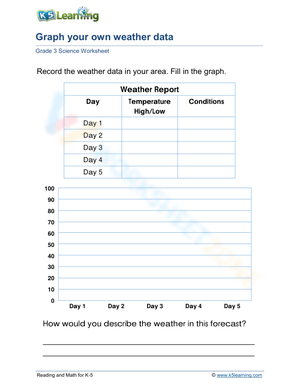
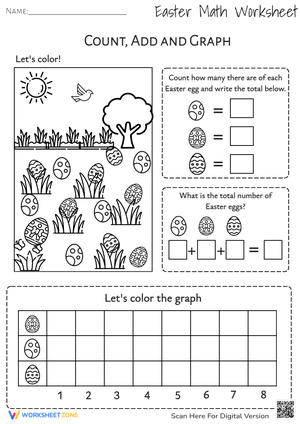
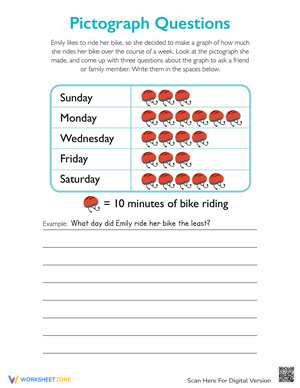
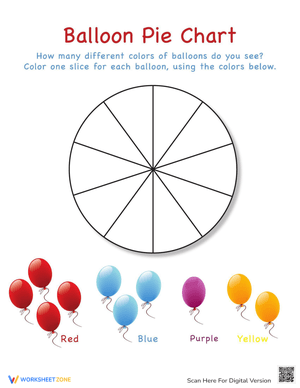
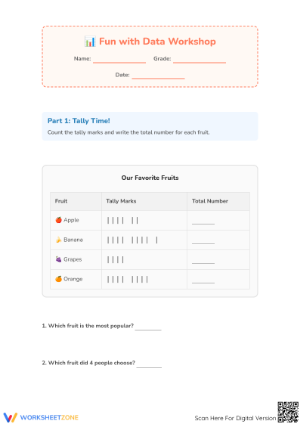
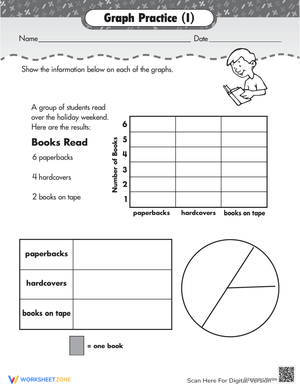
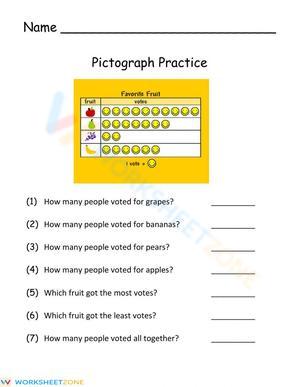
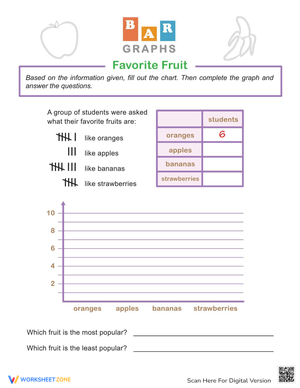
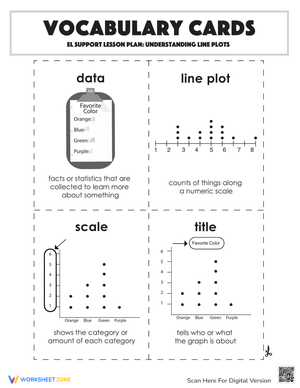
The resources move students through three graph formats in a deliberate sequence. Tally charts come first. Students sort objects or pictured items into categories and record counts using grouped marks — and this is where most second graders first internalize that data is organized information, not just a running list. The grouped-by-five structure of tally marks also quietly reinforces skip-counting, so this section doubles as number sense practice. Picture graphs follow, with a strict one-to-one scale: one symbol equals one item. That relationship keeps the math transparent while introducing the structural elements every graph requires — a title, labeled categories, and a key. Bar graphs close out the progression. Several worksheets ask students to take a completed tally chart and convert it into a bar graph, a two-step task that forces them to see identical data through two different visual formats.
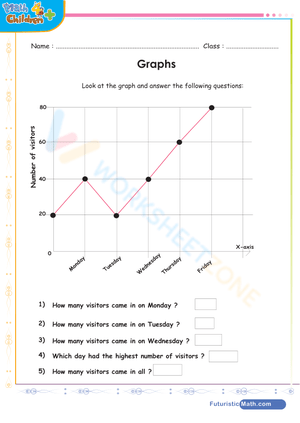
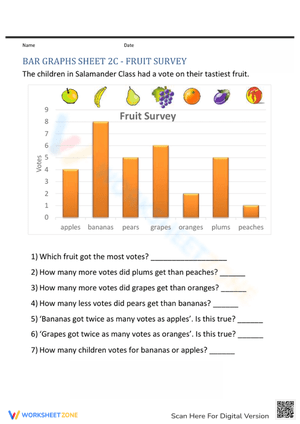
Interpretation questions anchor every worksheet. Students answer put-together, take-apart, and comparison questions drawn directly from the graph in front of them — not from memory or estimation.
Frequent Student Errors Worth Watching For
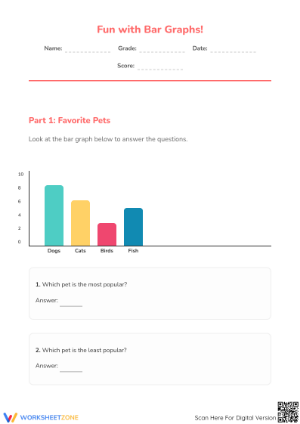
The comparison question is where second graders consistently lose points. "How many more students chose dogs than cats?" requires subtracting the smaller value from the larger, but a large share of seven-year-olds will instead add both bars together, or correctly identify the taller bar without performing any calculation at all. The phrase "how many more" doesn't yet carry reliable mathematical meaning at this age. Worksheets that cycle this exact question structure across multiple graph topics — different data sets, different categories, same phrasing — are what eventually make the operation automatic rather than guessed.
A second error appears during graph construction. Students who correctly complete a tally chart will sometimes drop a count when transferring totals to a bar graph, particularly when category totals reach eight or higher. This isn't a graphing error — it's a subitizing breakdown. When you see mismatched tallies and bars in the same student's work, you're looking at a working memory issue, not a conceptual misunderstanding about graphs. That distinction changes how you respond to it.
How to Build These Worksheets Into Your Lesson Plans
Math centers are the most natural home for these resources. One station setup that works well: a small bag of sorted materials (colored tiles, pattern blocks, or counting bears), a tally chart worksheet, and a bar graph worksheet in sequence. Students sort what they find, record the counts, then use those totals to build the bar graph on the second worksheet. The sequence takes roughly twelve to fifteen minutes and produces a concrete artifact you can review before the whole-group debrief.
Worksheets featuring pre-filled graphs work better as exit tasks than as independent-practice starters. Give students a completed picture graph and three interpretation questions — the last question should always be a comparison problem — during the final ten minutes of a math block. The pattern of answers across a class shows exactly which students have internalized the comparison structure and which need another round of guided practice with that language before the next lesson.
Topic choice matters more than it might seem. A 2nd grade graphing data worksheets pdf built around familiar categories — favorite recess activities, classroom pets, preferred snacks — reduces cognitive load substantially. When students already know what each category means, they spend their working memory on the math rather than on decoding the subject matter. That shift in attention shows up in more accurate graphs and more complete answer sections.
Standard Alignment
CCSS.MATH.CONTENT.2.MD.D.10 is the standard these resources address directly. It requires second graders to draw picture graphs and bar graphs representing data in up to four categories, then solve put-together, take-apart, and comparison problems using those graphs. The second half of that requirement — the word problem component — is what makes interpretation practice essential, not optional. Teachers who treat graph construction as the finish line leave students with half the skill the standard actually demands.
The standard specifies a single-unit scale at this level, meaning one picture or one bar segment represents exactly one item. That constraint is deliberate: it keeps the representational structure manageable enough for students to reason about additively without introducing multi-unit scaling, which arrives in later grades. Every worksheet in a well-built 2nd grade graphing data worksheets pdf for this grade operates within that one-to-one rule, and teachers should check for it before printing anything.
Adjusting the Worksheets for a Range of Learners
Students who move through the tally-to-bar sequence quickly are ready for an extension question: "Write a question that someone could answer just by reading your graph." Generating a comparison question from scratch — rather than answering one that's provided — demands a qualitatively different level of understanding and serves as a genuine challenge for students who need it.
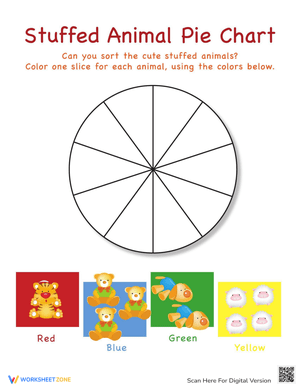
For students who struggle with bar graph construction, the most effective move is to hold them at the picture graph format longer and transition them to a bar graph only after they can reliably read one. Allowing these students to use stickers or stamps instead of drawing symbols removes fine motor friction and keeps their attention on the data logic. When they're ready for bars, using the same data set they already graphed as a picture graph minimizes the conceptual jump. The content stays constant; only the format changes.
Frequently Asked Questions
What graph types do these worksheets include?
The set covers tally charts, picture graphs, and bar graphs. Each format builds directly on the previous one. Students who complete the tally chart worksheets have the count data they need for the picture graph worksheets, and students who finish the picture graph worksheets are ready to convert that same data into bar graph format. Not every classroom needs to use all three in a single unit, but the option is there.
Can I use these worksheets with students who are still shaky on reading numbers to 20?
Yes, with some adjustment. The tally chart and picture graph worksheets work well for students still developing number sense up to 20, since counting individual marks or symbols is more concrete than reading a numerical axis. For bar graphs, where students must read a numbered scale, pair these students with a number line or hundreds chart during independent practice so the graphing skill stays the focus rather than number recognition.
How do I help students who consistently answer comparison questions incorrectly?
The most reliable fix is to act out the comparison before writing anything. Have the student place one cube per vote in two rows — one row for each category being compared — then match pairs until one row runs out of partners. The remaining unpaired cubes are the answer. This concrete step makes subtraction visible before the student touches a 2nd grade graphing data worksheets pdf with comparison word problems. Once the physical model is solid, the written practice clicks much faster.
Do the worksheets include answer keys?
Answer keys are included with the set. For graph-construction worksheets, the key shows a correctly labeled and filled-in graph. For interpretation worksheets, the key provides the expected numerical answers alongside the equation or reasoning that produces them — which makes the keys useful not just for grading efficiently, but for spotting partial-credit moments when a student's arithmetic is right but their setup is wrong.