These 2nd grade data and graphing pdf worksheets cover four graph formats—tally charts, picture graphs, bar graphs, and line plots—giving teachers a coordinated set of practice resources that maps directly onto the data and measurement strand of the second grade math curriculum. Each worksheet targets a distinct skill within that strand, so teachers can assign them in sequence or pull individual ones to address a specific gap. The set ends with comparison word problems that require students to read a completed graph and calculate how many more or fewer items appear in one category than another.
The Specific Skills These Worksheets Target
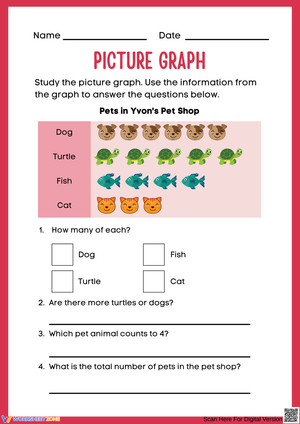
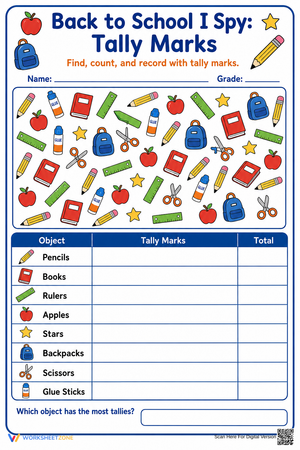
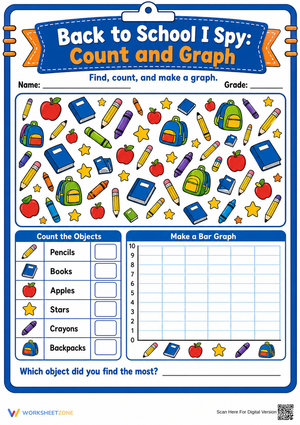
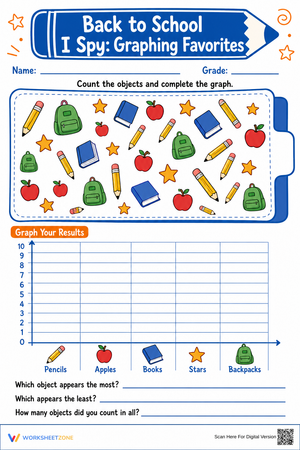
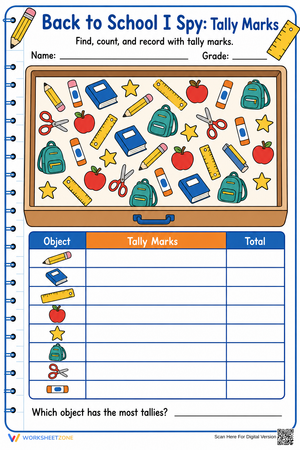
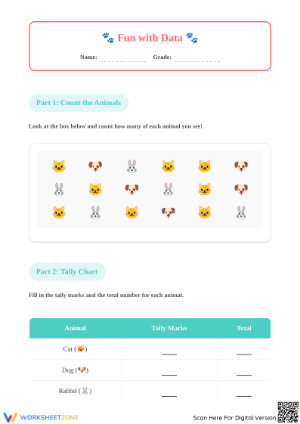
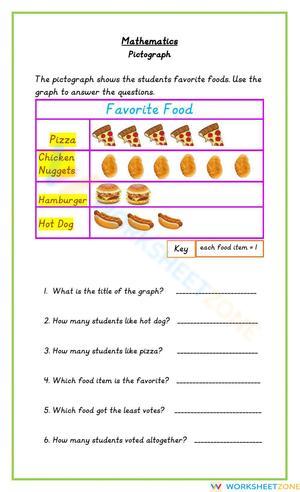
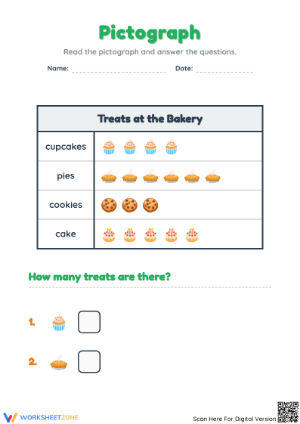
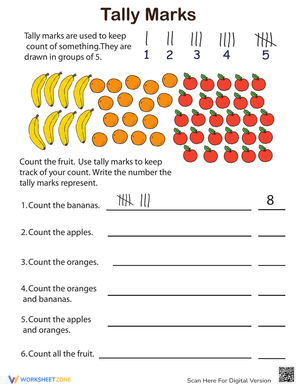
Tally charts come first in the progression because recording raw data is the prerequisite for every other format. Each tally worksheet has students mark responses in groups of five and then write the total—a step that seems small but trips up a surprising number of second graders when the groups don't land evenly at the end of a survey. Picture graph worksheets use a strict one-symbol, one-unit scale; at this grade, introducing a key where one picture equals two items creates more confusion than it resolves, so these 2nd grade data and graphing pdf worksheets stay with the direct one-to-one relationship throughout.
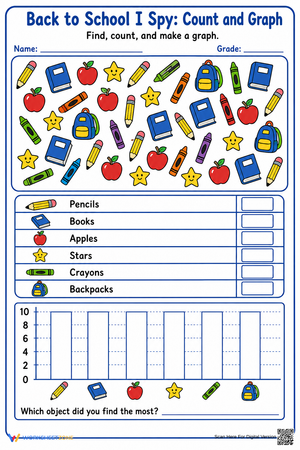
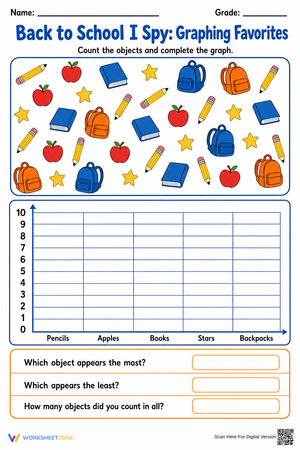
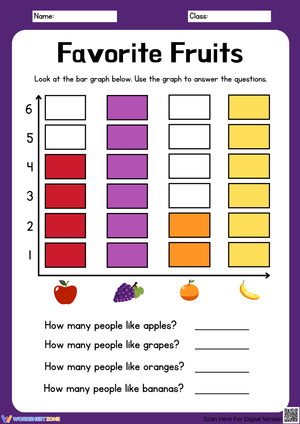
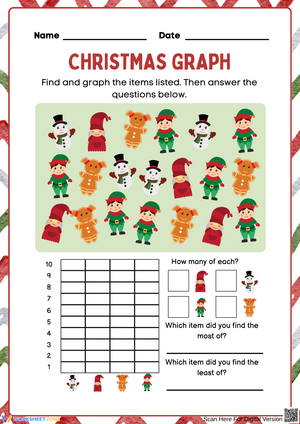
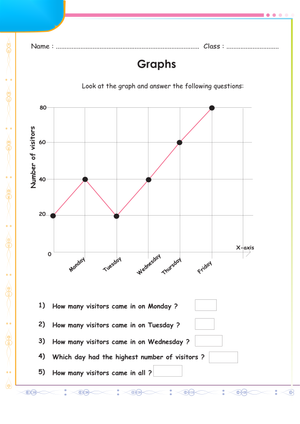
Bar graph worksheets cover both vertical and horizontal orientations with up to four categories. Students draw the bars, write category labels, number the scale, and give the graph a title. Line plot worksheets connect to whole-number measurement: students receive a set of recorded measurements—lengths of classroom objects in inches, for example—and mark each value with an X above a pre-drawn number line. The final worksheets in the set require students to read a completed bar graph and answer "how many more" and "how many fewer" questions, which is where real analytical thinking begins.
Mistakes Students Make That These Worksheets Surface
The most persistent tally error isn't a miscount—it's a mis-draw. A student who makes four vertical marks and one diagonal slash for a group of five will sometimes omit the diagonal entirely and write five vertical marks instead, then read that cluster as four when transferring data to a bar graph. The resulting bar height is off by one for every complete group of five, and the student has no idea why the graph doesn't match the survey results. These worksheets isolate tally practice before introducing the graphing step, which makes that specific error visible and correctable before it compounds into something harder to untangle.
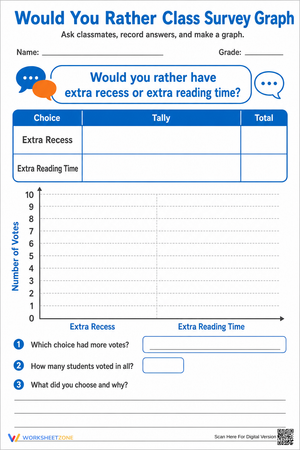
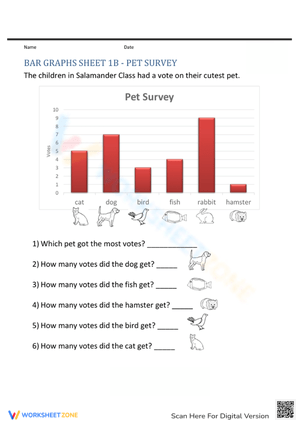
Comparison questions produce a different category of mistake. A second grader shown a bar graph where cats reaches 8 and dogs reaches 5 and asked "how many fewer dogs are there than cats?" frequently answers 13. The word "fewer" doesn't yet signal subtraction—it signals that both numbers are involved, and the student adds them. Teachers who catch this early can use connecting cubes to build both bars physically and remove cubes from the taller stack until the towers match; the leftover cubes become the answer. Once students have done that concretely a few times, the subtraction connection holds when they return to the worksheet.
A third pattern worth flagging: students who draw clean, accurate bars but leave the graph functionally unreadable. No title. No label on the vertical axis. Category names abbreviated or missing entirely. The bars are correct—the student understood the data—but the graph communicates nothing to a reader who wasn't present for the survey. This is less a graphing misconception than a communication habit that needs deliberate instruction at the checklist level.
Fitting These Worksheets Into a Real Teaching Week
The sequence that works best for most teachers starts with a physical experience before paper practice. On the first day, run a quick classroom survey—favorite recess game, preferred lunch item, whatever generates genuine interest—and have students place sticky notes in category columns on the whiteboard. Once the physical bar graph is built together, hand out a blank bar graph worksheet and ask students to transfer the whiteboard data onto paper. Because the data is already organized and visible, students can focus entirely on the mechanics of labeling and scaling rather than managing data collection and graph construction at the same time. That reduction in competing demands makes a real difference in how accurately students handle axis labels on their first attempt.
Line plot worksheets fit naturally alongside any measurement lesson already in the schedule. Have students measure five or six classroom objects to the nearest whole inch, record the results on a tally chart worksheet, and then use a line plot worksheet to display the full class data set. The two worksheets become a two-step activity that practices recording and representing data without feeling like disconnected tasks. For the Friday math block, the comparison word problem worksheets make strong closure activities—they take ten to fifteen minutes, produce written responses teachers can scan quickly, and show clearly which students are ready to move forward.
Standard Alignment
The full set addresses CCSS Math.Content.2.MD.D.10, which requires second graders to draw picture graphs and bar graphs with up to four categories and solve put-together, take-apart, and comparison problems using bar graph data. Within the classroom, this standard typically appears in the second half of the school year after students have built fluency with addition and subtraction within 100—because comparison questions like "how many fewer" require students to recognize subtraction as the appropriate operation and apply it in context. These 2nd grade data and graphing pdf worksheets are sequenced to support exactly that instructional placement: tally and picture graph worksheets come first, comparison word problems last.
Adjusting the Worksheets Across a Range of Learners
Students who need additional support benefit most from the tally chart and picture graph worksheets before touching bar graphs. The one-to-one correspondence in those formats—one mark, one object; one symbol, one unit—is a concrete stepping stone toward the more abstract work of reading a scaled axis. For those students, pairing a tally worksheet with physical counters and letting them group the counters before recording gives them something tangible to anchor the written marks to.
For students who move through the core worksheets quickly, the comparison word problem worksheets are the natural extension point. A student who can answer "how many more" can be pushed to explain why their subtraction equation matches what they see in the graph—a step toward the mathematical discourse that becomes important in 3rd and 4th grade. Some teachers add a blank grid to the back of a completed bar graph worksheet and ask faster finishers to represent the same data in a different format, which requires genuine conceptual flexibility rather than more repetition of the same skill.
Line plot worksheets tend to have the widest range of entry points in a typical second grade class. Students who are still shaky on number line placement need extended time with the pre-drawn number lines in these 2nd grade data and graphing pdf worksheets before moving to open-ended versions where they must determine the scale themselves.
Frequently Asked Questions
Do these worksheets cover both vertical and horizontal bar graphs?
Yes. Bar graph worksheets in the set include both orientations. Vertical and horizontal bar graphs share the same underlying logic but look visually different, and second graders benefit from seeing both before encountering a test item that presents one they haven't practiced. Labels, scales, and titles are required on every bar graph worksheet regardless of orientation.
Can line plot worksheets be paired with a measurement unit?
That pairing is actually how these worksheets are most productively used. Line plots at this grade level require whole-number measurement data, which means any measurement activity that produces a list of lengths in whole inches gives students real data to plot. The worksheets include pre-drawn number lines with whole-number intervals, so students can focus on placing X marks accurately rather than setting up the scale from scratch.
How are the comparison word problems formatted?
Each comparison worksheet shows a completed bar graph with four categories and three to five questions below it. Questions include straightforward reading tasks ("How many students chose soccer?"), put-together problems ("How many students chose soccer or basketball combined?"), and comparison problems ("How many more students chose soccer than baseball?"). The structure keeps all three problem types on the same worksheet so teachers can see at a glance which type a student handles confidently and which one stalls them.