These 2nd grade tally charts printable pdf worksheets give teachers a ready-to-use set of data activities that move students through the full arc of early data work — from recording raw observations to reading and comparing results across categories. The set focuses on tally marks as both a practical counting tool and a clear bridge to bar graphs, building number sense that shows up across the rest of second-grade math.
What Students Practice
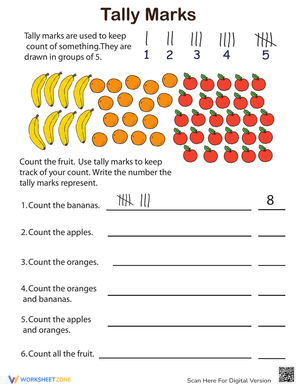
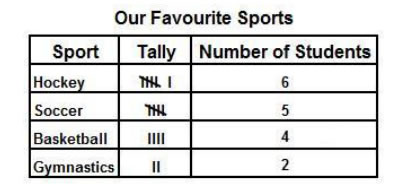
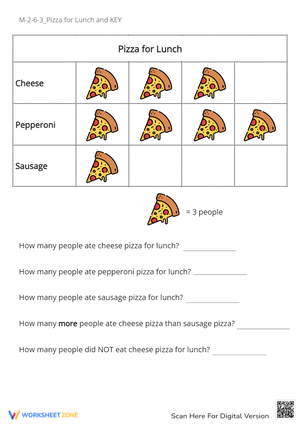
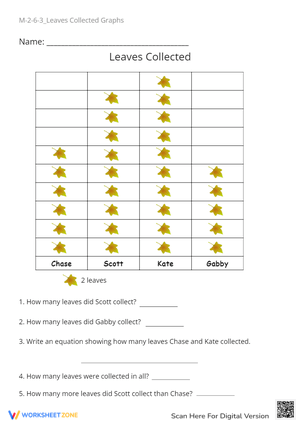
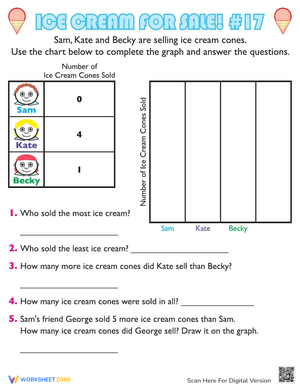
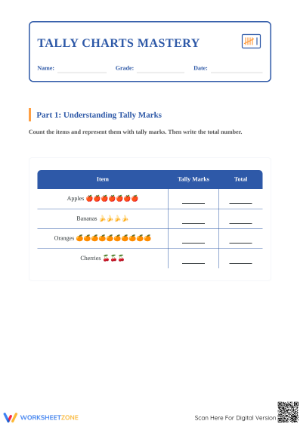
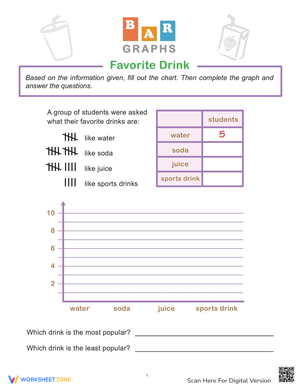
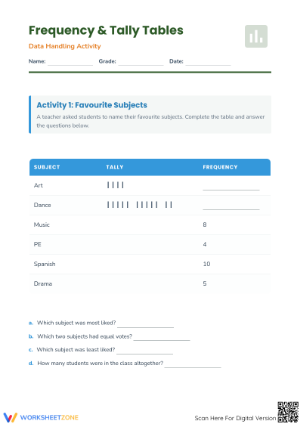
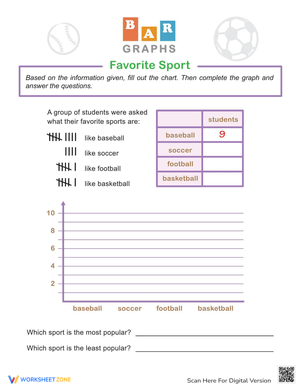
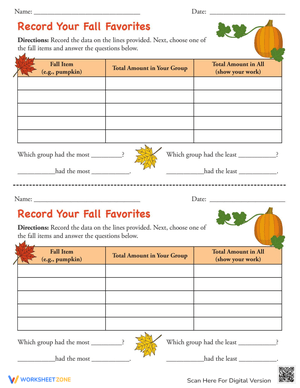
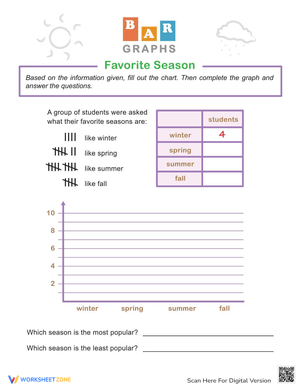
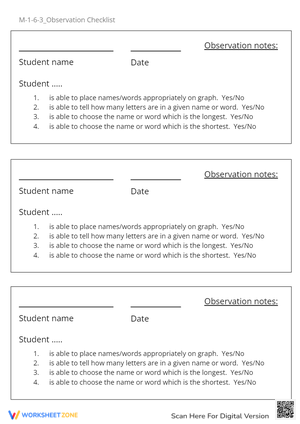
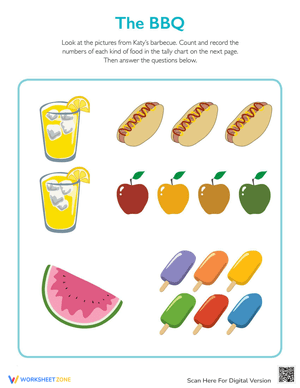
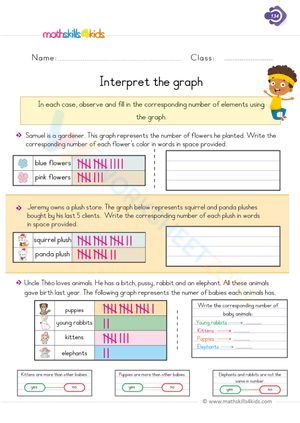
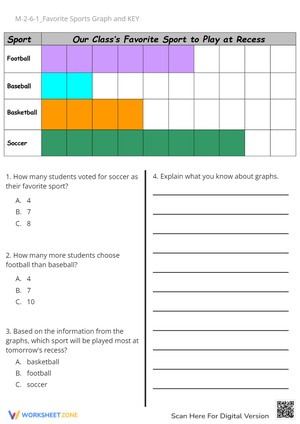
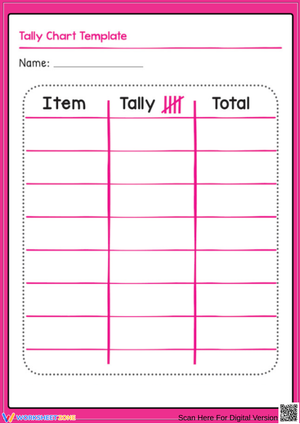
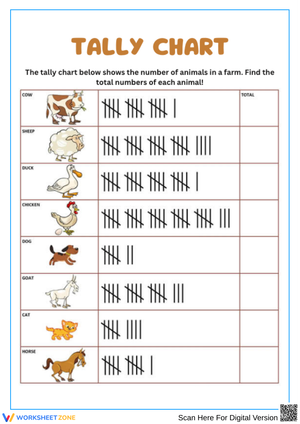
The 2nd grade tally charts printable pdf worksheets in this set target a specific slice of the data strand with each task rather than cycling through the same type of problem repeatedly. Activities include counting scattered objects — autumn leaves, classroom supplies, insects — and recording totals using tally marks; completing partially filled charts where some categories are given and others are left blank; transferring finished tally data onto a bar graph frame; and answering comparison questions using addition and subtraction. A separate group of worksheets functions as classroom survey activities, where students carry a clipboard, poll peers, and record live responses.
That last type matters more than it might first appear. When a student walks the room tallying actual answers from classmates, the tally mark stops being an abstract symbol and becomes a purposeful recording tool. The data belongs to them — which consistently improves accuracy on the graphing step that follows.
Common Misconceptions to Watch For and Correct
The most reliable error in student tally work is not the diagonal fifth mark itself — it is what happens just before it. Students often draw four marks, lose their count, and add a fifth vertical line instead of crossing the group. The resulting cluster looks like five verticals plus a stray mark, and the total comes out one too high. That single-count error then cascades directly into the bar graph: the bar ends up one unit too tall, and every comparison problem built on that category comes out wrong.
A second pattern worth watching is what students do with scattered picture sets. When a worksheet presents 18 leaves arranged in a loose cluster rather than tidy rows, some students count the same image twice or skip one entirely. The fix is a crossing-out habit — students mark each object with a small X as they tally it. This is worth teaching explicitly rather than correcting after the fact. Students who develop that habit in second grade carry it into science data collection and any future situation where they're tallying from a visual field.
Standard Alignment
CCSS.MATH.CONTENT.2.MD.D.10 asks students to draw a picture graph and a bar graph representing a data set with up to four categories, then solve put-together, take-apart, and compare problems using that data. Tally charts don't appear by name in the standard, but they are the natural prior step. A student who organizes raw data into a tally chart first is far more accurate when constructing a bar graph, because counting and plotting are separated into two distinct tasks rather than handled simultaneously. Teachers who introduce tallying before bar graphs consistently see fewer errors at the graphing stage — students aren't trying to count and plot at the same time.
Fitting These Worksheets Into Your Lesson Sequence
The strongest use of this set comes from spreading practice across the week rather than front-loading it into one data lesson. A two-minute Monday warm-up — students tally a picture set and record the totals — primes attention at the start of the day without requiring a full math block. By Friday, students who have done that warm-up four times are noticeably more accurate than those who practiced the same skill once in a 45-minute sitting. Spaced repetition works for procedural skills the same way it works everywhere else.
Before releasing students to independent work, spend five minutes at the whiteboard building tally groups aloud with the class — actually drawing marks and counting them together. The move from shared modeling to solo worksheet work is where you learn the most about individual students. Watch who skip-counts the bundles by fives and who re-counts every single mark from one. That observation tells you where to redirect before the graphing unit begins in earnest.
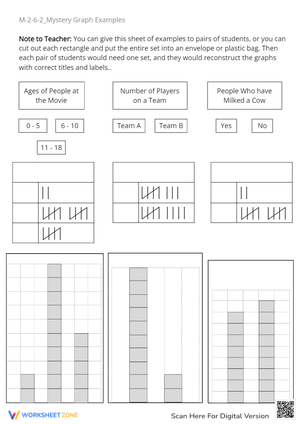
The classroom survey worksheets fit naturally into the 10 to 15 minutes before math rotations. Assign one student as the data collector, circulating with a clipboard, while others work on a different task. Their collected results become the class's shared dataset for that day's worksheet — which gives the activity a real-world weight that printed scenarios don't fully replicate. One practical note: the comparison word problems on some worksheets expect students to read the question independently. For students still working on decoding below grade level, the analytical thinking gets buried under the reading demand. Reading those questions aloud during independent practice keeps the math accessible without altering the task itself.
Adjusting the Set for a Range of Learners
For students still working on one-to-one correspondence, limit practice to tallying sets of 10 or fewer items and pre-draw the category headers so students aren't managing two unfamiliar tasks at once. A simple counting mat alongside the worksheet — where a student moves a counter for each object before making the mark — takes enough off the working memory load that they can focus entirely on the tally convention.
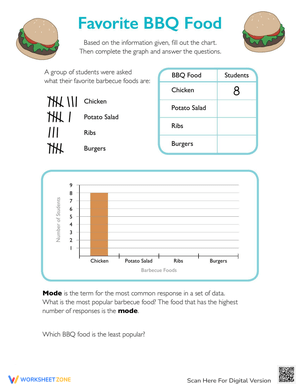
Students moving quickly through the material benefit from a writing extension rather than more tallying. After completing the chart, ask them to write three comparison sentences about the data before plotting it on the bar graph. A statement like Dogs got 7 more votes than fish requires reading the chart, subtracting, and producing language — a meaningfully harder cognitive task than recording marks. That extension doesn't need a separate resource; it's a written prompt added at the bottom of an existing worksheet. On the other end of the range, the 2nd grade tally charts printable pdf worksheets include enough variety in category count and data set size that teachers can assign lighter or heavier versions based on student readiness without building new materials from scratch.
Frequently Asked Questions
What is the most effective way to introduce the diagonal fifth mark?
Before pencil touches paper, have students build tally groups using popsicle sticks or toothpicks. Four sticks stand vertically; the fifth is physically placed across them. The kinesthetic act of crossing the bundle tends to anchor the rule in a way that watching a whiteboard demonstration alone doesn't. Once students have physically built and counted a few groups, the pencil version follows naturally, and the five-verticals-in-a-row error rarely reappears.
How do these worksheets connect tally work to skip counting by fives?
The 2nd grade tally charts printable pdf worksheets in this set are structured so that data sets produce totals that land on multiples of five, which makes the skip-counting habit immediate rather than incidental. Every completed bundle is a concrete unit. When students need to find a total, pointing to each group and counting 5, 10, 15 is faster and more accurate than re-counting individual marks. That experience makes skip counting feel purposeful — students see exactly why it matters rather than practicing it in the abstract.
Can these worksheets work as formative assessment tools?
A brief walkthrough during independent practice reveals a great deal without pulling students aside for a formal check. Students drawing five vertical marks in a row instead of the diagonal grouping need a quick redirect before that error becomes a habit. Completed comparison word problems tell you whether students can interpret data or are only recording it. Both types of evidence are easy to gather in real time, which makes these worksheets useful at the start of a data unit just as much as at the end.