


Views
Downloads
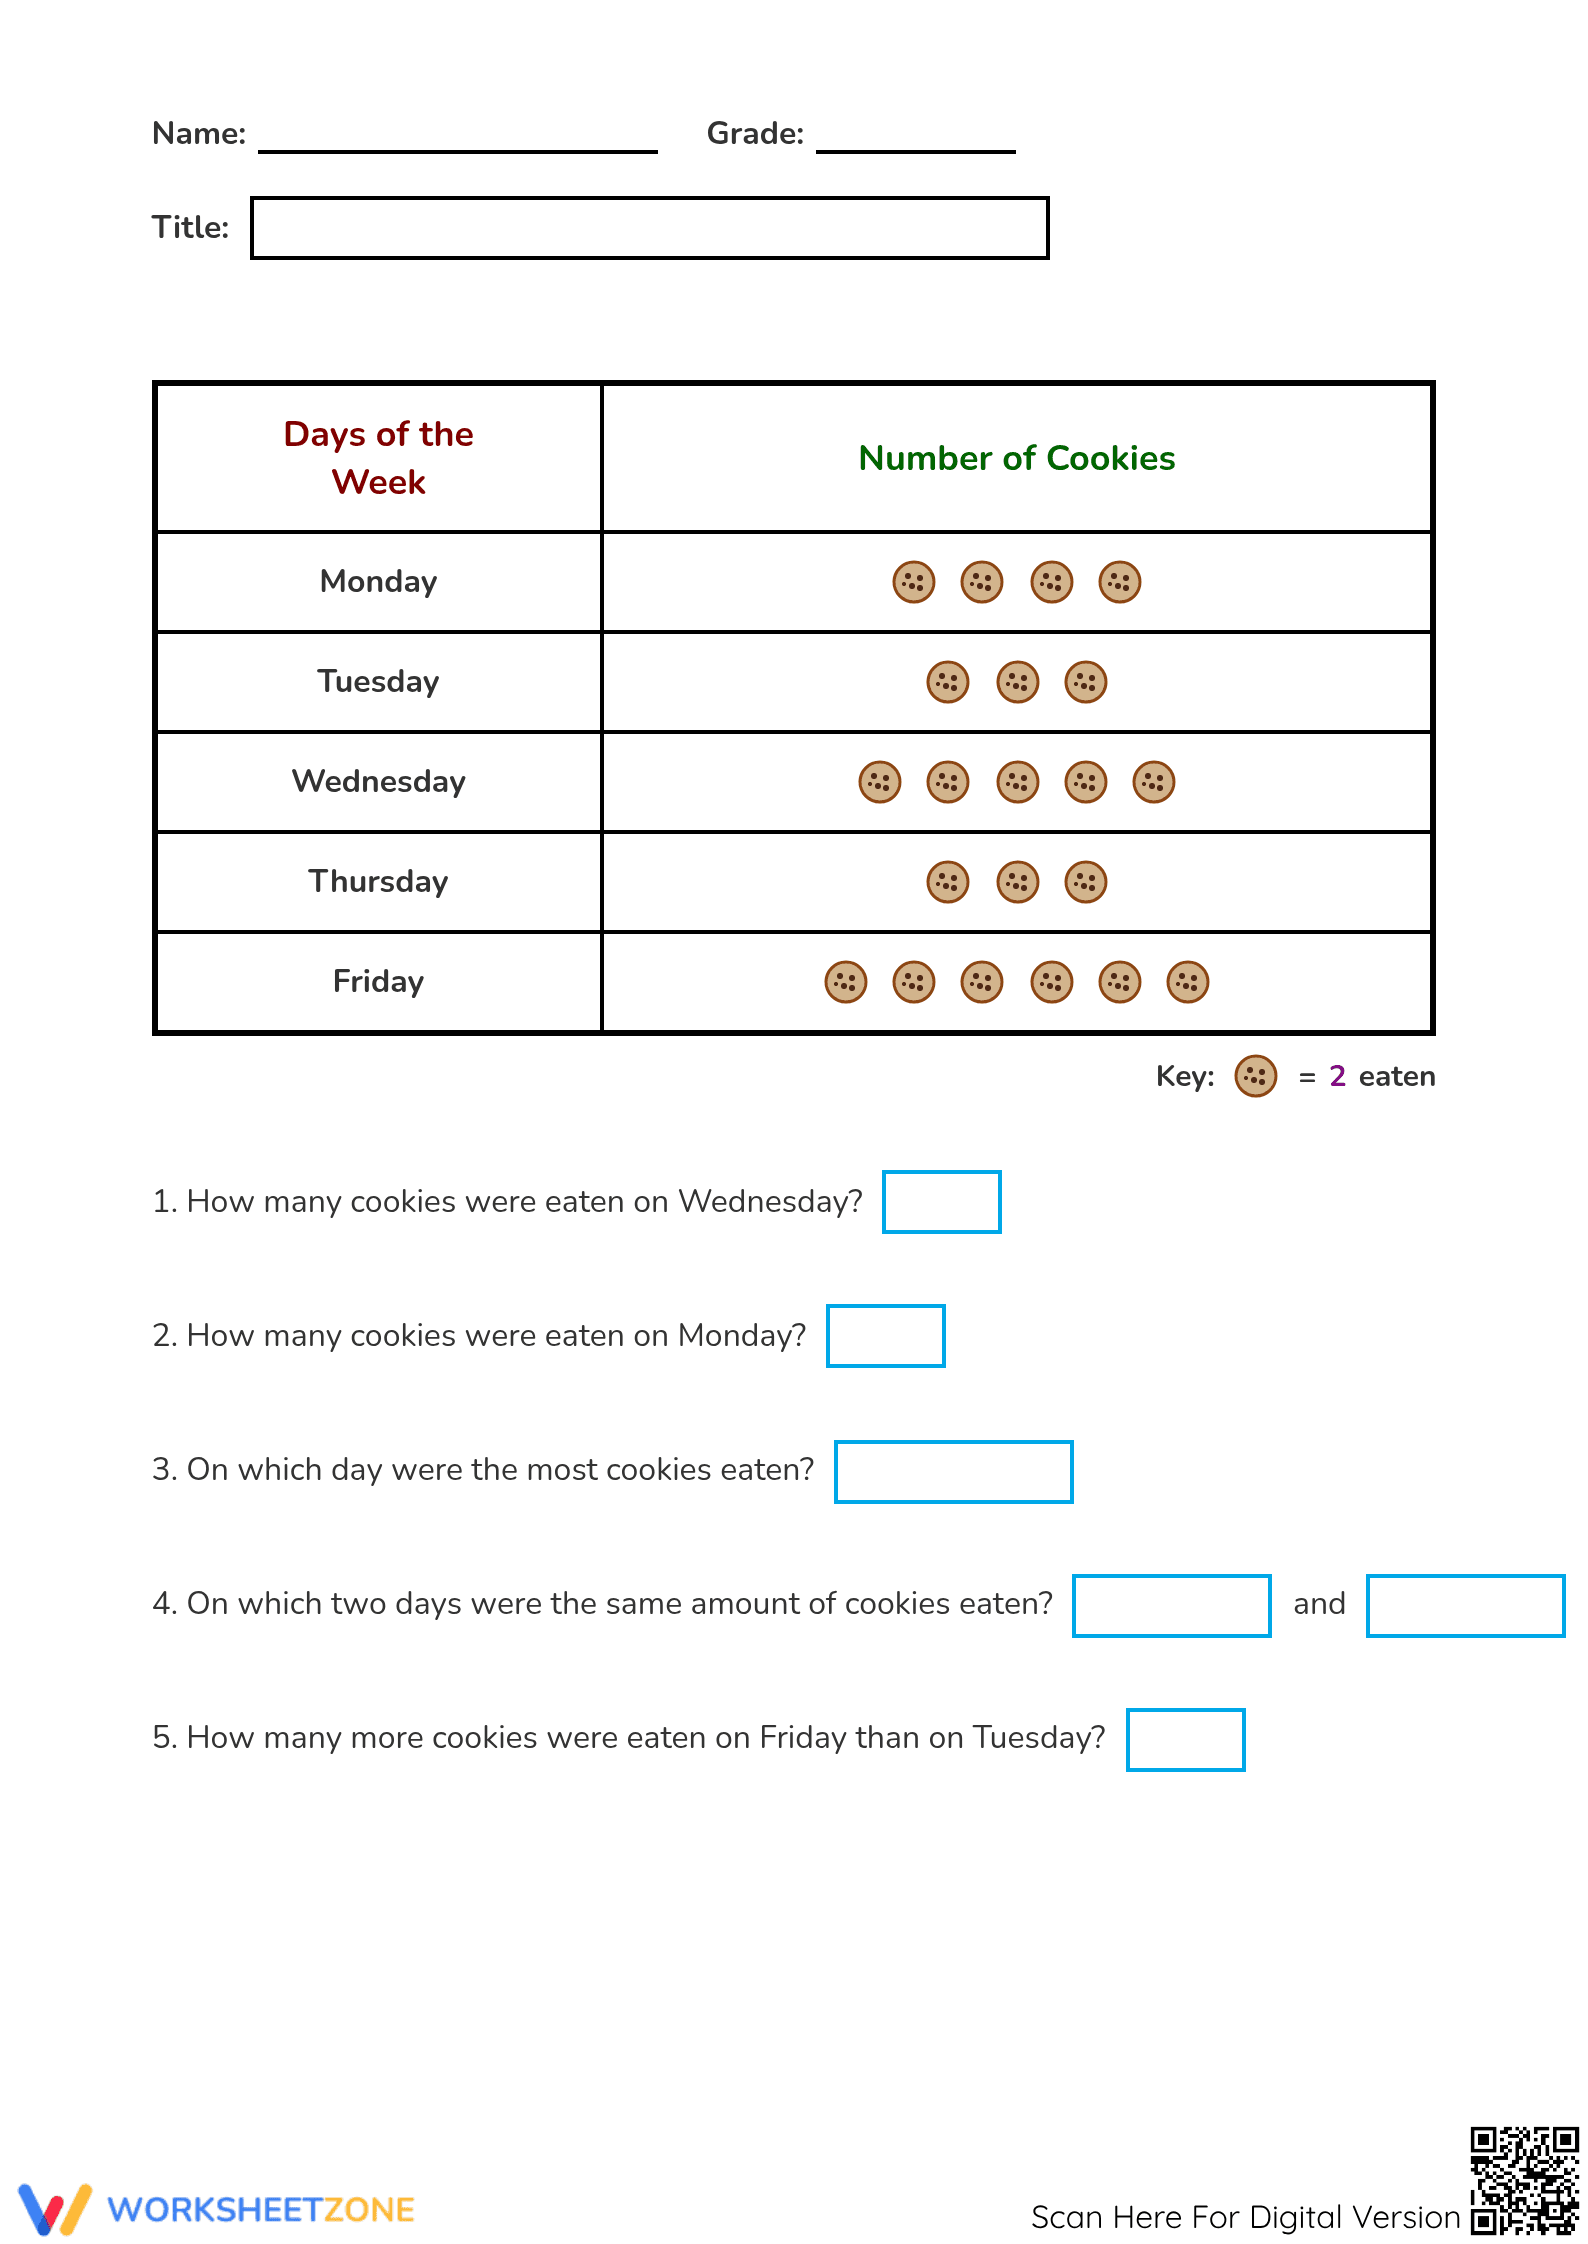
Essential Pictograph Key 2 Worksheet | Grade 2 Math
Paste this activity's link or code into your existing LMS (Google Classroom, Canvas, Teams, Schoology, Moodle, etc.).
Students can open and work on the activity right away, with no student login required.
You'll still be able to track student progress and results from your teacher account.
This Grade 2 math worksheet helps students master data interpretation through a practical pictograph focused on cookies eaten throughout the week. By analyzing the visual representation and applying a key of 2, learners develop critical multiplication and addition skills while answering five targeted questions. It is an ideal resource for reinforcing data fluency in young mathematicians.
At a Glance
- Grade: 2 · Subject: Math
- Standard:
CCSS.MATH.CONTENT.2.MD.D.10— Interpret picture graphs with a key of 2 to represent data sets and solve comparison problems- Skill Focus: Interpreting pictographs where symbols represent multiple units (Key: 2)
- Format: 1 page · 5 problems · Answer key included · PDF
- Best For: Independent student practice, small group instruction, or quick formative assessment
- Time: 10–15 minutes
The worksheet features a clear, organized table titled "Number of Cookies" mapped across five days of the week, from Monday to Friday. Students are presented with a pictograph where each cookie icon represents 2 actual cookies eaten. Below the graph, five specific comprehension questions challenge students to calculate daily totals, identify maximums, compare values between days, and find matching amounts. A comprehensive answer key is provided to facilitate quick grading.
This resource is designed for immediate classroom integration with a three-step workflow: Print the single-page PDF, distribute to students during your data unit, and review the answers using the included key. With a total preparation time of under two minutes, it serves as an excellent emergency sub plan, "bell ringer" activity, or a focused homework assignment that requires no additional teacher setup.
The primary alignment for this resource is CCSS.MATH.CONTENT.2.MD.D.10: "Draw a picture graph and a bar graph (with single-unit scale) to represent a data set with up to four categories. Solve simple put-together, take-apart, and compare problems using information presented in a bar graph." While this worksheet introduces a dual-unit scale (key of 2), it directly supports the interpretive demands of the standard. This standard code can be copied directly into lesson plans, IEP goals, or district curriculum mapping tools.
Introduce this worksheet after a direct instruction session on how graphs can represent larger numbers using keys. Use it as a formative-assessment tool by observing if students remember to multiply the cookie icons by 2 or if they simply count the symbols; this identifies who needs further support with scale interpretation. Most students will complete the exercise within 10 to 15 minutes, making it perfect for a "check for understanding" exit ticket.
This activity is tailored for second-grade students learning to navigate data sets, though it provides reinforcement for third graders reviewing foundational graphing concepts. It is particularly effective for visual learners who benefit from concrete representations of numerical data. Pair this worksheet with a physical counting exercise using manipulatives or a passage about healthy snacking to create a cross-curricular learning experience.
According to research from Fisher & Frey (2014), the gradual release of responsibility in mathematics is most effective when students transition from visual models to abstract calculations. This Grade 2 pictograph worksheet embodies this principle by requiring students to interpret a key of 2, bridging the gap between simple counting and introductory multiplication. By answering five structured questions about "Number of Cookies," learners engage with the CCSS.MATH.CONTENT.2.MD.D.10 standard in a way that builds both procedural fluency and conceptual understanding. The clear layout and scaffolded questions ensure that students can independently practice data interpretation, providing teachers with a reliable measure of student mastery. This resource adheres to NAEP guidelines for data representation, ensuring that students are prepared for the complexity of higher-grade statistics and probability tasks.