


0
Views
0
Downloads
0.0
0
Save
0 Likes
Favorite Food Pictograph Worksheet
0 Views
0 Downloads
Paste this activity's link or code into your existing LMS (Google Classroom, Canvas, Teams, Schoology, Moodle, etc.).
Students can open and work on the activity right away, with no student login required.
You'll still be able to track student progress and results from your teacher account.
Information
Description
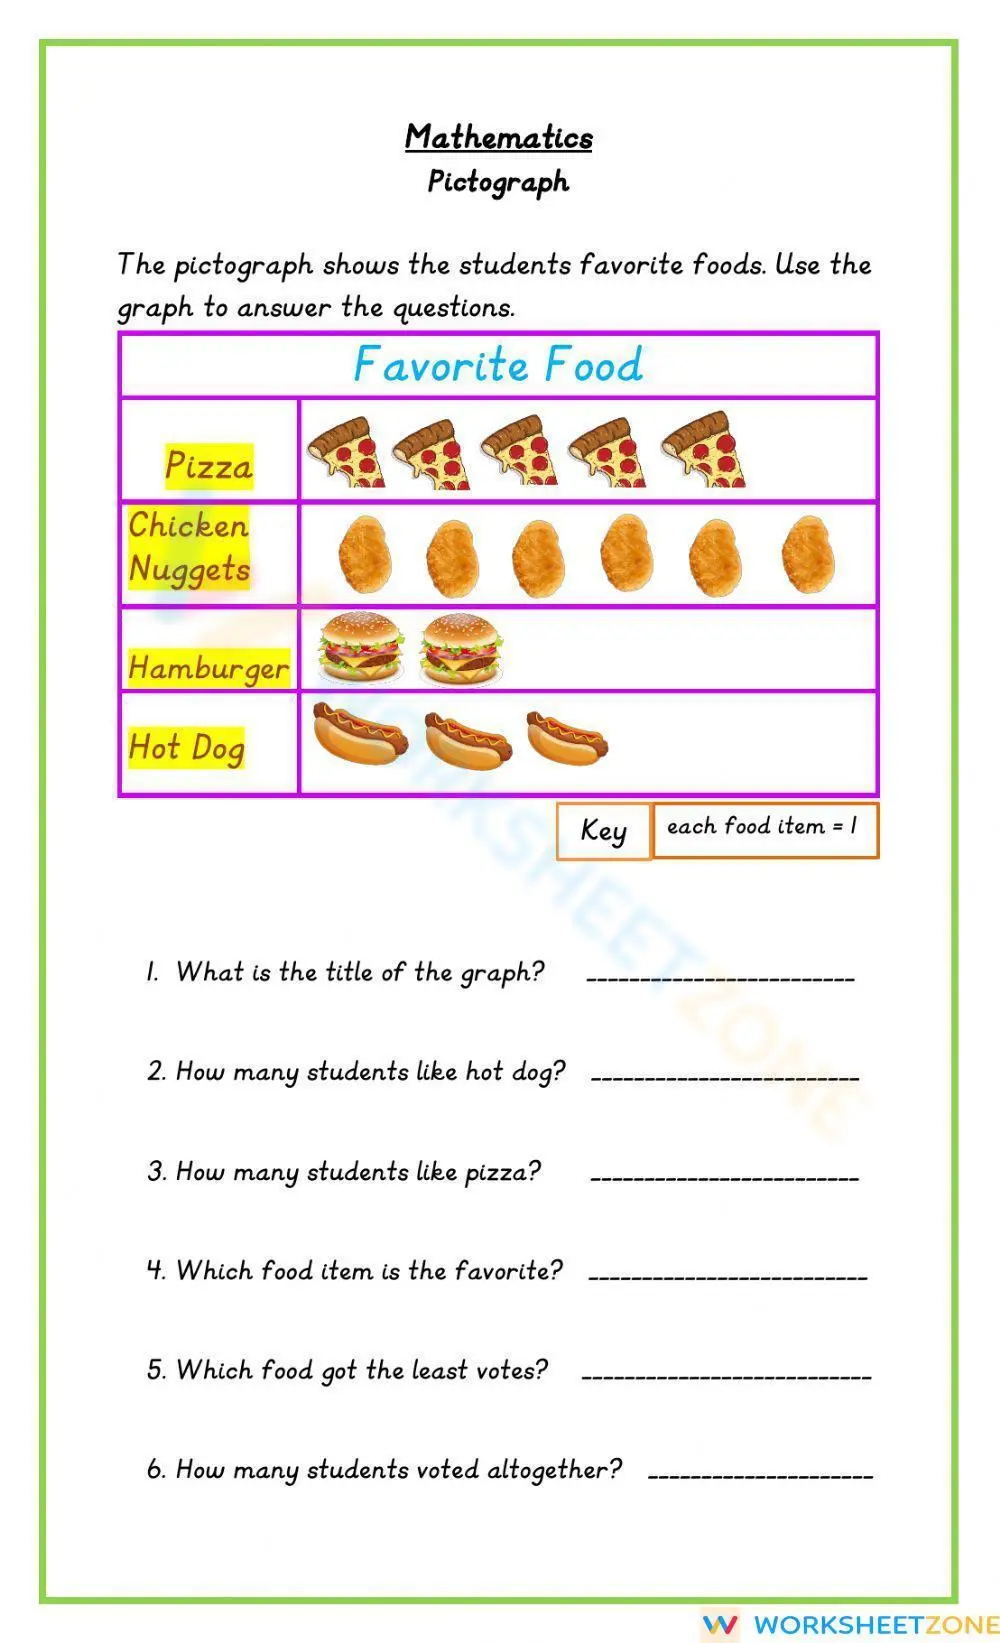
What It Is:
This worksheet introduces students to reading and interpreting a pictograph that shows students’ favorite foods.
Students analyze picture symbols, use the key to count votes, and answer questions based on the data shown in the graph.
Why Use It:
Working with pictographs helps students build early data analysis and graph-reading skills.
This worksheet strengthens counting, comparison, and reasoning skills while making math relatable through familiar food choices.
How to Use It:
• Review the pictograph and explain how the key represents each vote
• Have students count the pictures to answer each question
• Discuss which food has the most and least votes
• Use as classwork, homework, or data handling practice
Grade Suitability:
Best suited for Grade 2–3.
• Appropriate for early data and graphing lessons
• Supports foundational math and visual interpretation skills
Target Users:
Elementary teachers, parents, tutors, and students learning basic graphing and data analysis concepts.