


Views
Downloads
Grade 1 Bar Graph & Tally Chart — Essential Math Worksheet
Paste this activity's link or code into your existing LMS (Google Classroom, Canvas, Teams, Schoology, Moodle, etc.).
Students can open and work on the activity right away, with no student login required.
You'll still be able to track student progress and results from your teacher account.
This comprehensive Grade 1 data analysis worksheet empowers students to master the fundamentals of graphing and information organization. By engaging with visual representations of insects and birds, learners practice the critical transition from raw observations to structured mathematical data. Students will successfully identify quantities, compare categories, and perform basic arithmetic operations within a real-world context.
At a Glance
- Grade: 1 · Subject: Math
- Standard:
1.MD.C.4— Organize, represent, and interpret data with up to three categories- Skill Focus: Data Interpretation
- Format: 5 pages · 21 problems · Answer key included · PDF
- Best For: Independent practice or formative assessment
- Time: 20–30 minutes
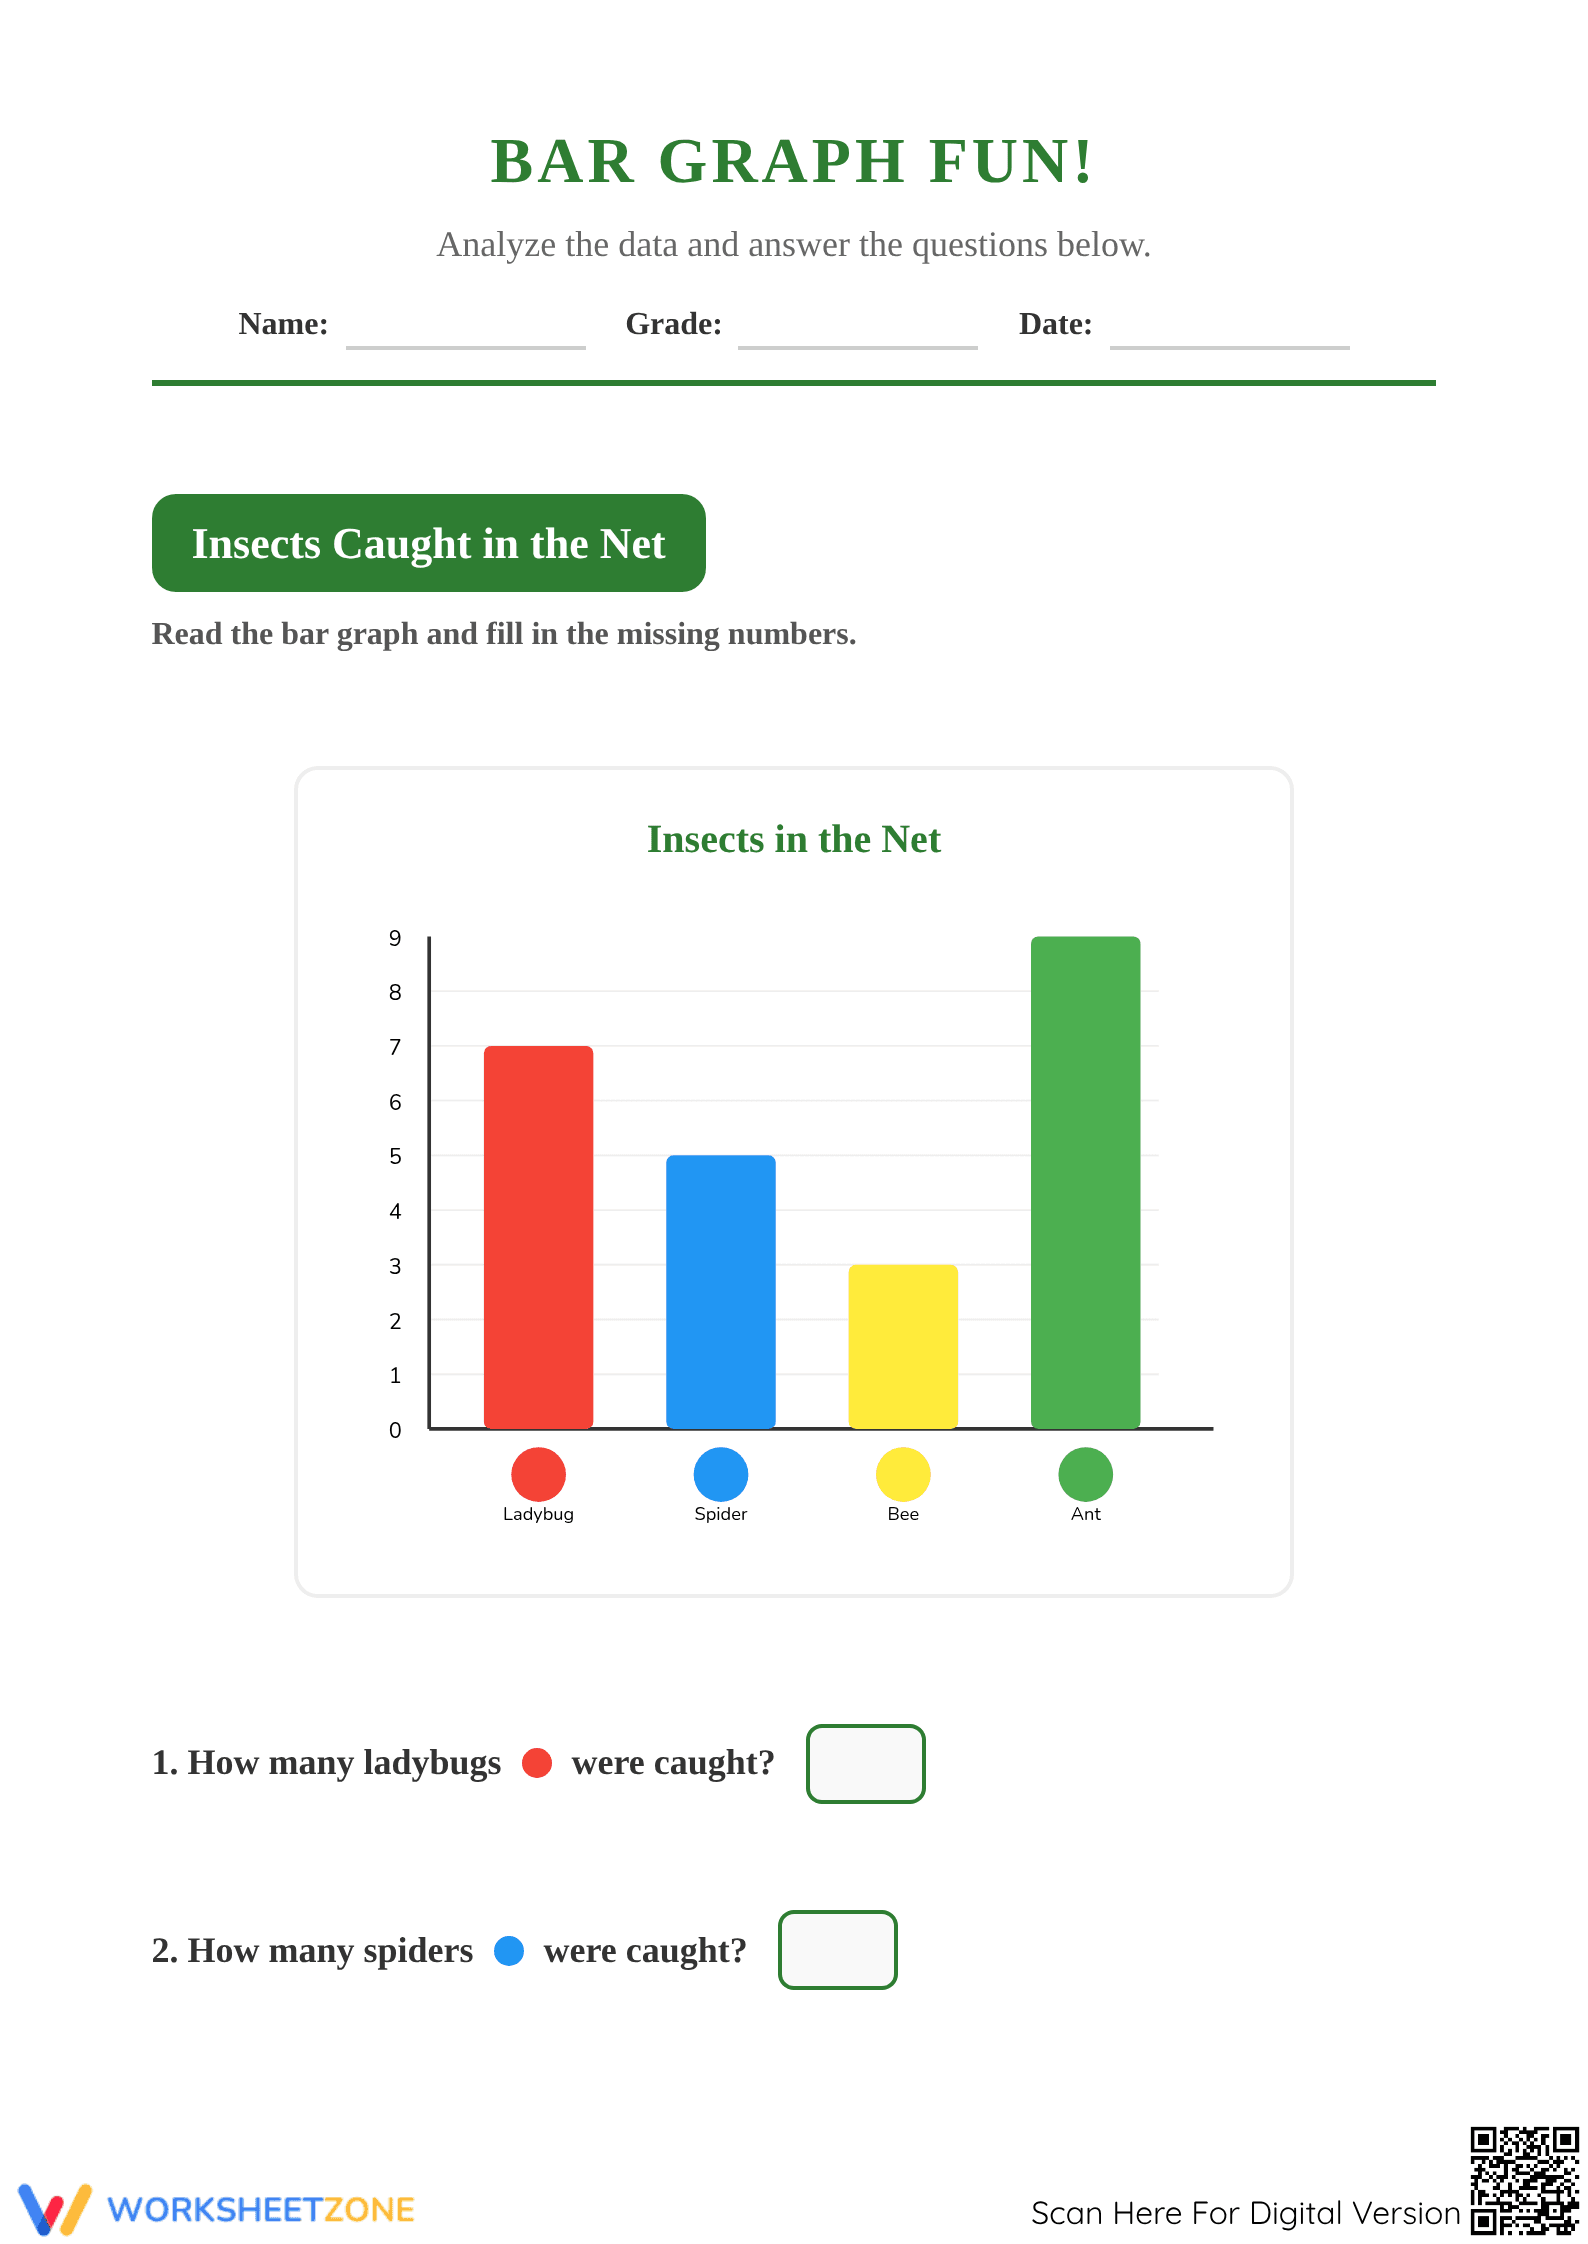
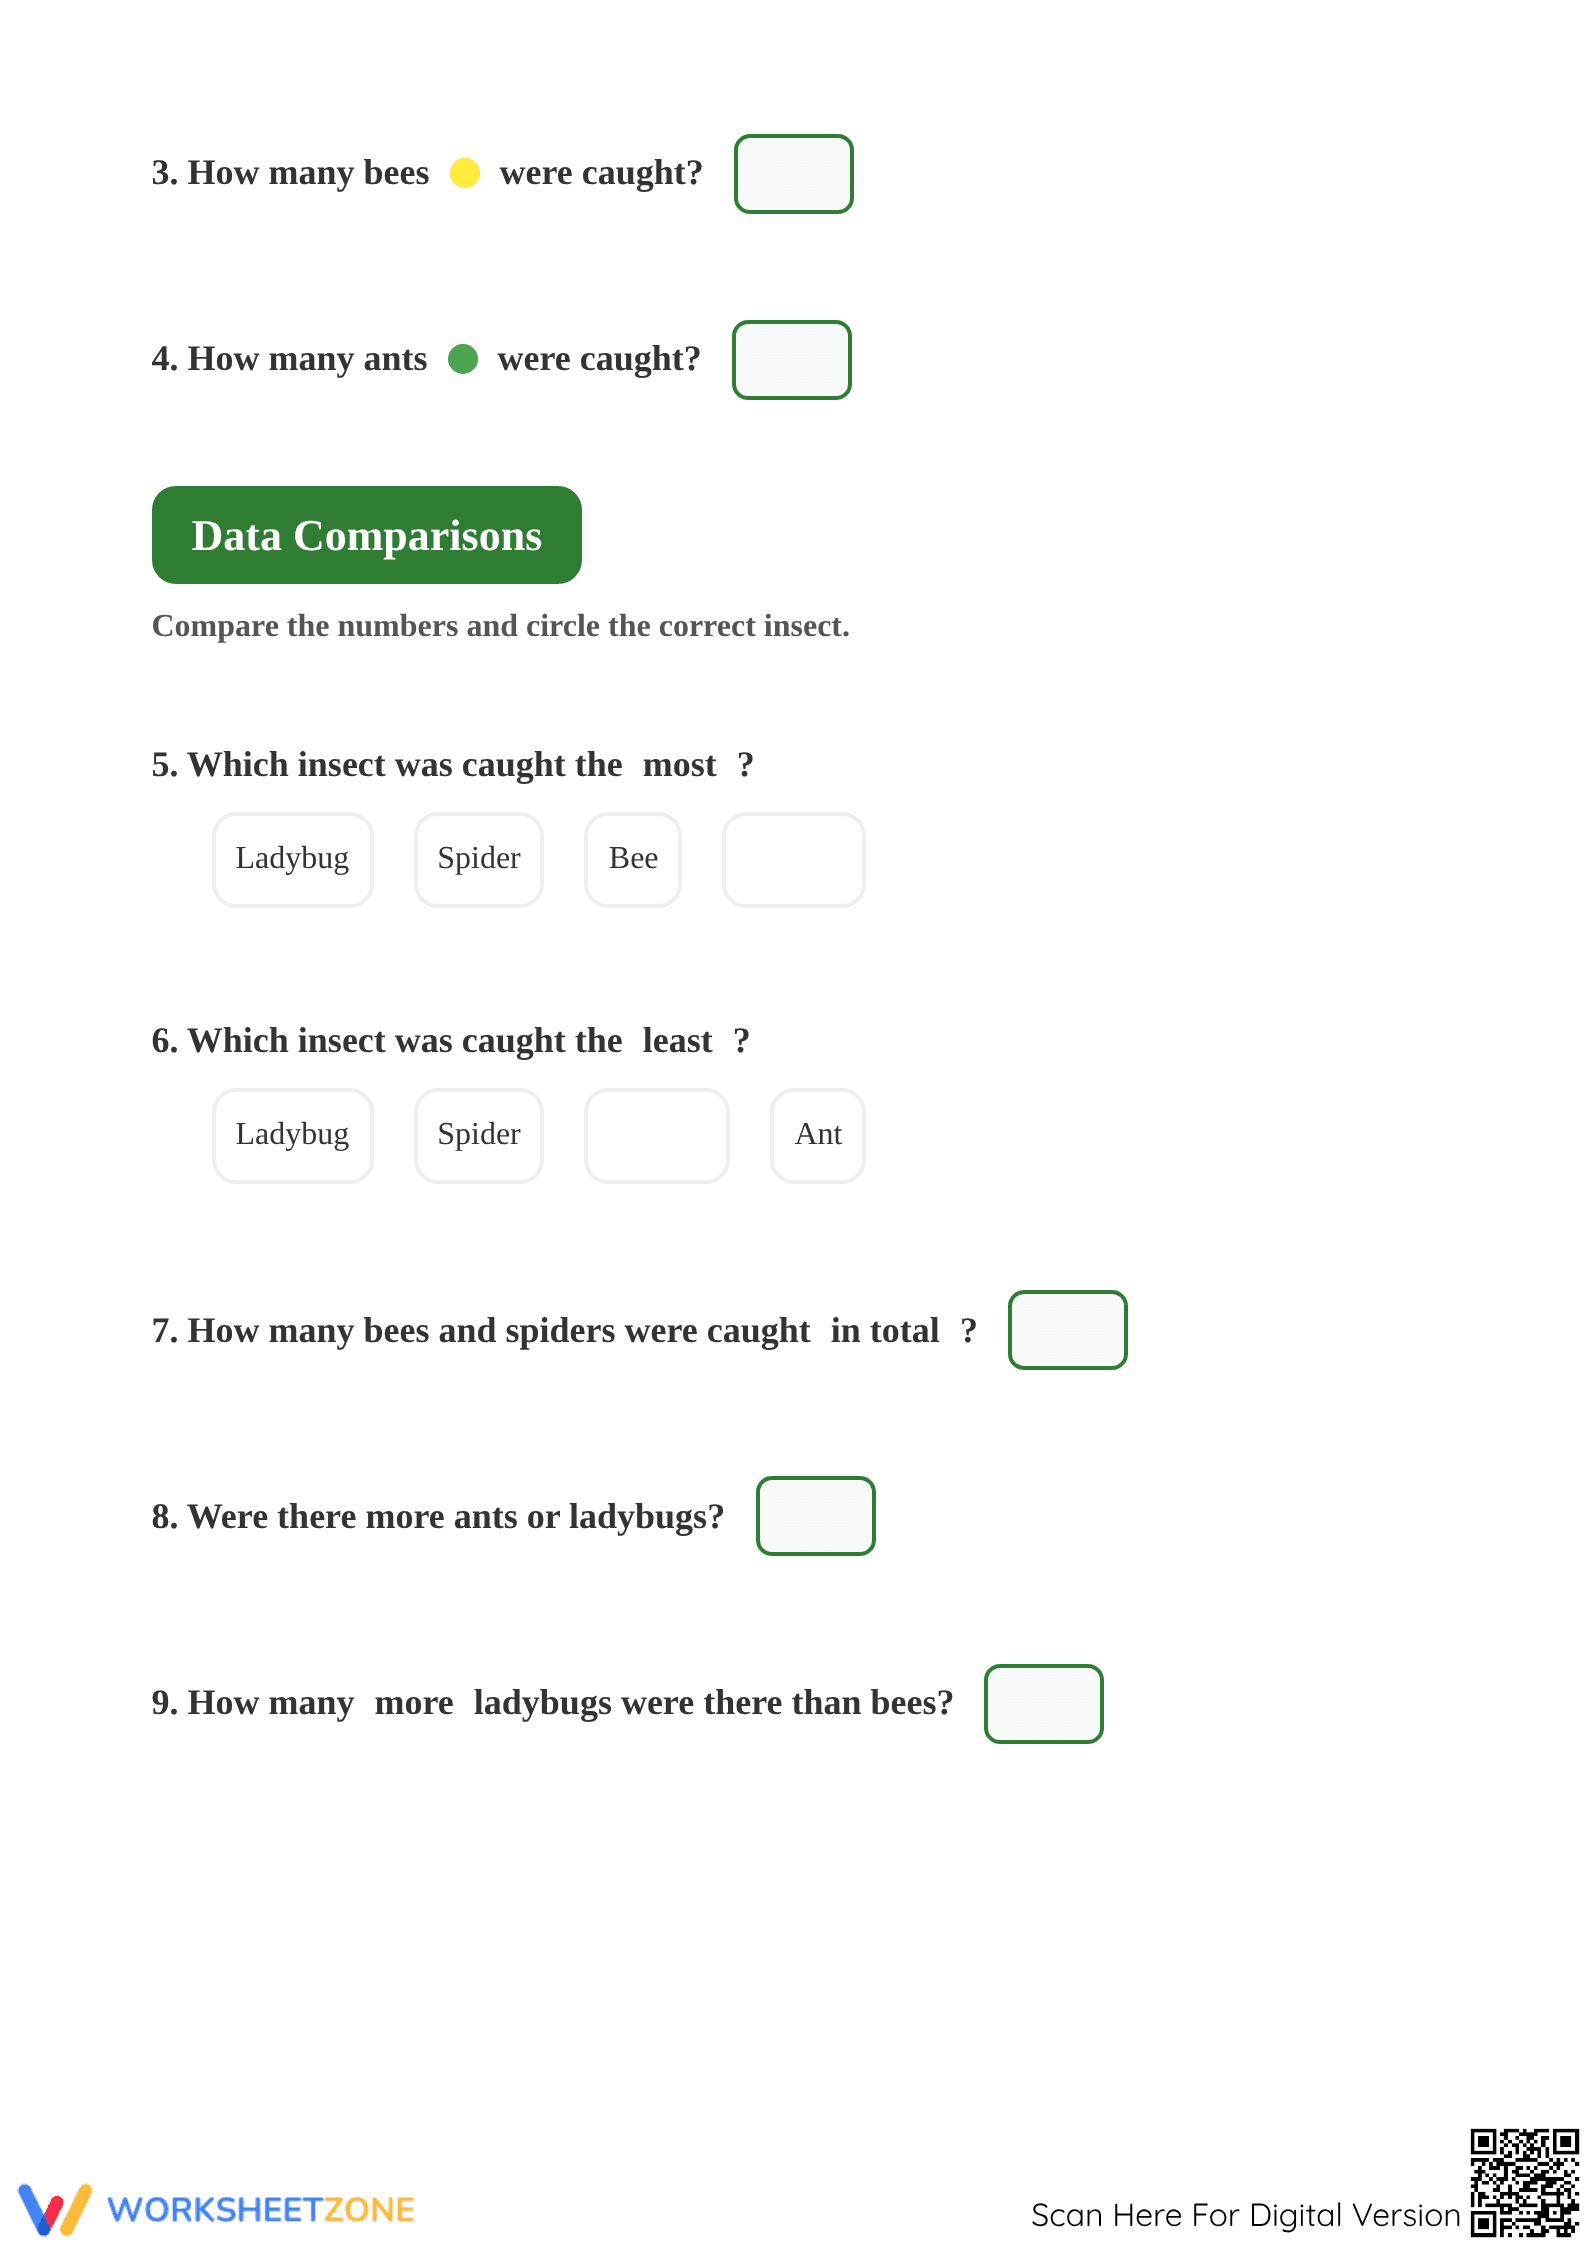
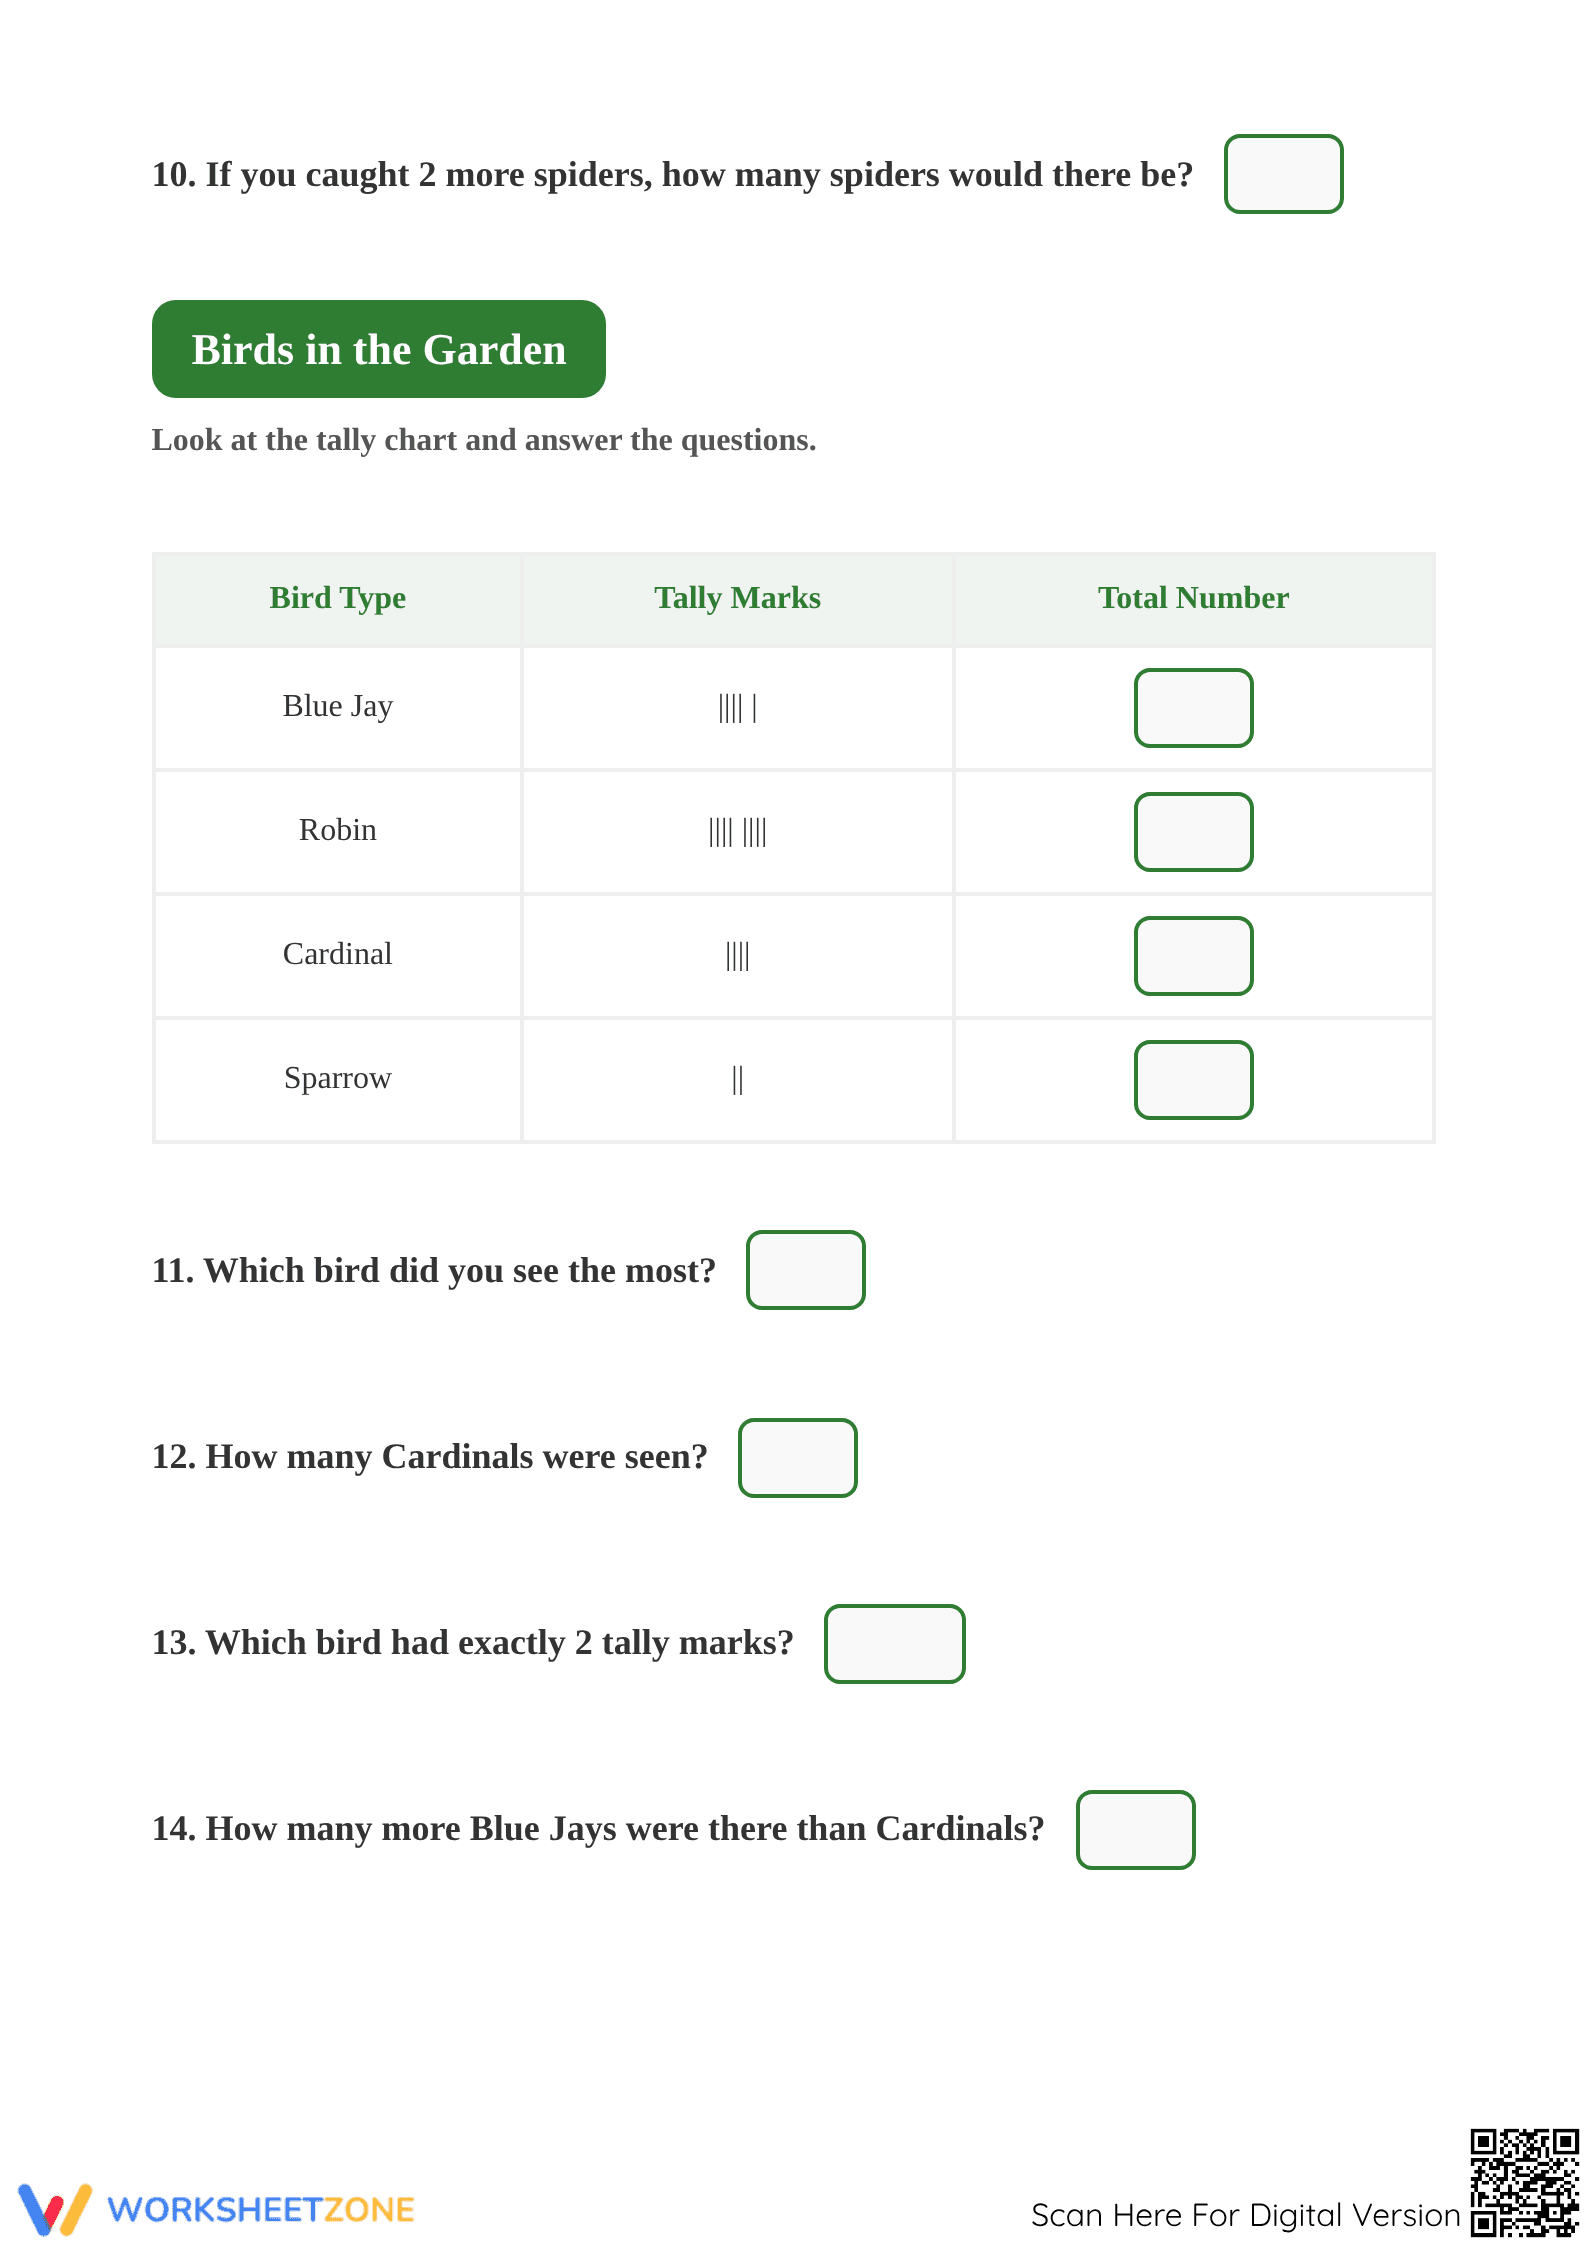
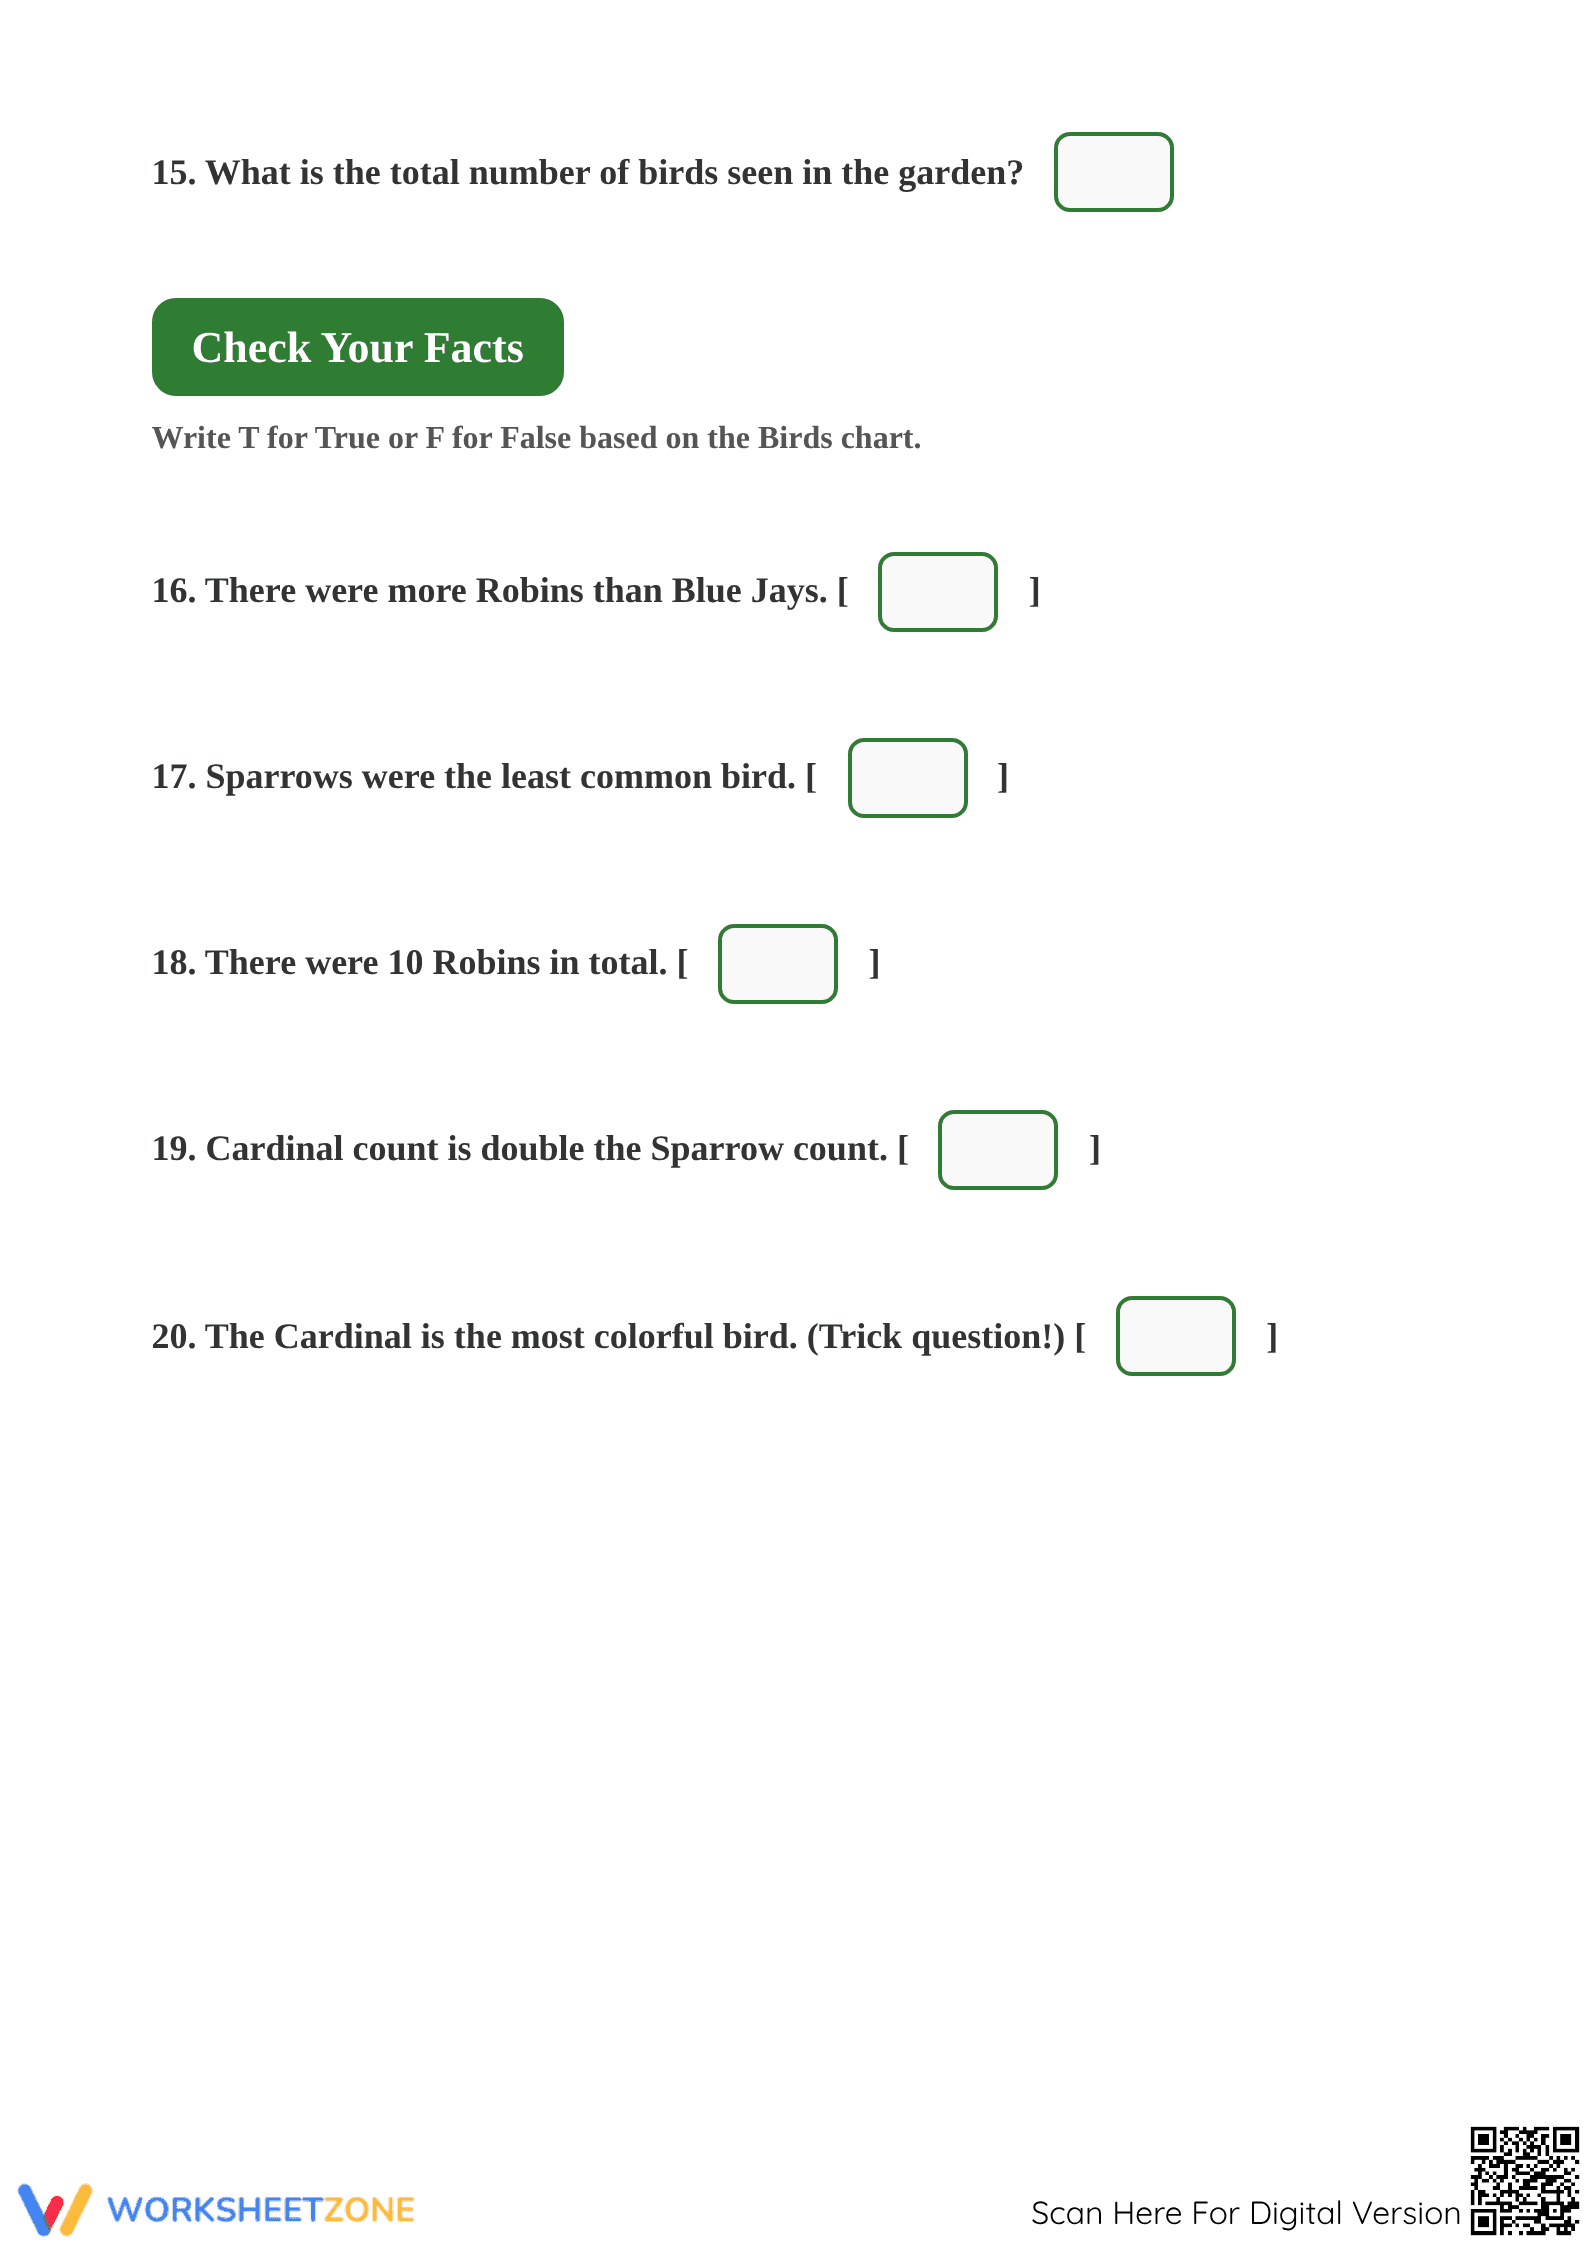
What's Inside: This 5-page PDF resource features two distinct data sets. The first section utilizes a colorful bar graph titled "Insects Caught in the Net," while the second section introduces a tally chart focused on "Birds in the Garden." The packet includes 20 structured questions ranging from simple identification to complex comparisons, a true/false logic section, and a bonus creative graphing task. A full answer key is provided for rapid grading.
Zero-Prep Workflow: This resource is designed for immediate classroom implementation. First, print the 5-page packet (approximately 30 seconds). Second, distribute to students for independent work or use as a guided math center activity (1 minute). Third, review the results using the included answer key to identify specific misconceptions in data comparison or tally counting (under 2 minutes). It serves as an ideal sub-plan or morning work activity.
Standards Alignment: This worksheet is strictly aligned to `CCSS.MATH.CONTENT.1.MD.C.4`. Students must organize, represent, and interpret data with multiple categories, answering questions about the total number of data points and how many more or less are in one category than another. This standard ensures students build the logical foundation required for more advanced statistical analysis in later grades. Both standard codes can be copied directly into lesson plans, IEP goals, or district curriculum mapping tools.
How to Use It: Deploy this worksheet during the "You Do" phase of a gradual release lesson on data. It works exceptionally well as a mid-unit formative assessment to check if students can distinguish between "how many" and "how many more." Teachers should observe students as they process the tally marks to ensure they understand the diagonal slash represents a group of five. Completion typically takes 25 minutes for most first-grade learners.
Who It's For: This resource is tailored for first-grade students but provides excellent remediation for second graders or an advanced challenge for kindergartners. It is particularly effective for visual learners who benefit from color-coded bars and clear tally representations. Pair this with a physical sorting activity or an anchor chart showing different graph types for a complete instructional cycle.
Research from RAND AIRS 2024 indicates that frequent exposure to varied data representations, such as switching between bar graphs and tally charts in a single session, significantly improves mathematical flexibility in early elementary students. By requiring students to interpret 21 distinct data points across different visual formats, this worksheet reinforces the cognitive shift between counting and comparing. The inclusion of "how many more" questions directly addresses a common NAEP identified struggle point in primary mathematics. This structured approach ensures that students do not merely read numbers but actually analyze the relationships between data sets, a skill that is foundational for future STEM success. The clear layout and incremental difficulty allow for high student engagement without the need for constant teacher intervention, making it a reliable tool for building data literacy.