


Views
Downloads
Grade 3 Weather Charting Worksheet — Essential Science
Paste this activity's link or code into your existing LMS (Google Classroom, Canvas, Teams, Schoology, Moodle, etc.).
Students can open and work on the activity right away, with no student login required.
You'll still be able to track student progress and results from your teacher account.
This Grade 3 science worksheet provides a structured framework for students to record and visualize local weather patterns over five days. By bridging the gap between observation and graphical representation, the activity helps learners identify trends in temperature and conditions, reinforcing the concept that weather is a measurable phenomenon.
At a Glance
- Grade: 3 · Subject: Science
- Standard:
3-ESS2-1— Represent weather data in tables and graphs to describe typical conditions- Skill Focus: Data recording and graphical displays
- Format: 1 page · 3 tasks · Answer key included · PDF
- Best For: Weekly science observations and data units
- Time: 15–20 minutes
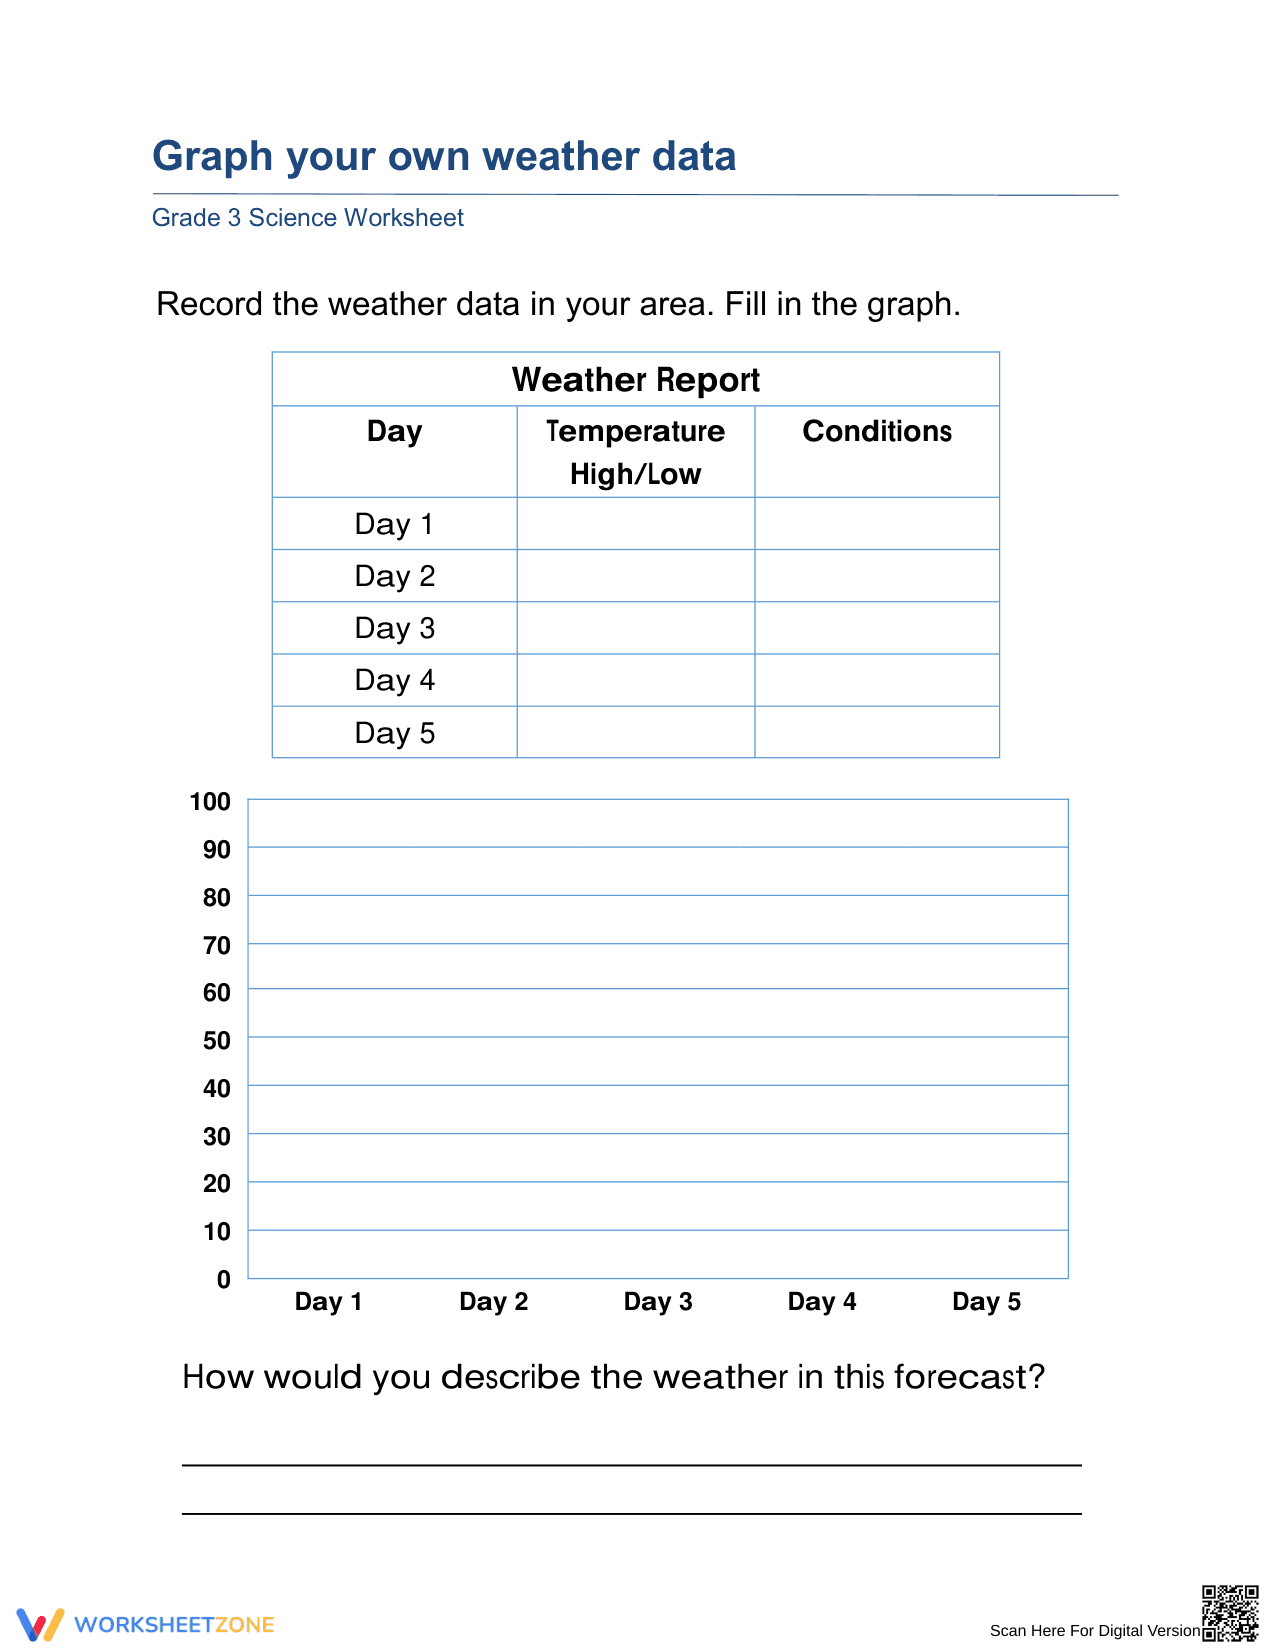
The worksheet features a three-part layout for immediate classroom use. It begins with a "Weather Report" table for tracking temperature and conditions for five days. Below, a pre-formatted line graph template allows students to plot their recorded temperatures, providing a visual representation of change. The activity concludes with a critical thinking prompt asking students to describe their forecast findings, ensuring they move beyond simple data entry toward authentic scientific analysis and interpretation.
Zero-Prep Workflow
Designed for a zero-prep workflow, this resource integrates into any science block. Teachers can implement this in three steps: print the single-page PDF (30 seconds), distribute for daily observations (5 minutes daily), and review the completed graphs to discuss trends (10 minutes). This efficiency makes it an ideal choice for substitute plans or as a consistent weekly anchor.
Standards Alignment
This resource is aligned to the Next Generation Science Standard 3-ESS2-1. It requires students to "represent data in tables and graphical displays to describe typical weather conditions expected during a particular season." By recording real-world data and translating it into a graph, students use evidence to support scientific claims. This standard code can be copied directly into lesson plans, IEP goals, or district curriculum mapping tools to ensure rigorous instructional alignment.
How to Use It
Use this worksheet as a formative assessment during a unit on Earth's systems. It works best when assigned at the start of a week, allowing for a complete five-day data set. A useful tip is to have students compare observations with local news forecasts, observing how data varies. This encourages students to verify their findings like professional meteorologists during their science investigations.
Who It's For
This worksheet is ideal for third-grade classrooms and homeschooling. It is effective for visual learners who benefit from seeing numeric data transformed into spatial charts. Pair this resource with a weather-themed reading passage or a digital thermometer exploration to provide students with the background knowledge needed to accurately measure temperature and identify complex atmospheric conditions within their local environment.
According to a RAND AIRS 2024 study on elementary science instruction, early exposure to data modeling through graphical representation improves a student's ability to interpret complex informational texts. This worksheet targets standard 3-ESS2-1 by providing a guided structure for recording and graphing weather data, ensuring Grade 3 students transition from simple observation to evidence-based analysis. By using a standardized table and a line graph, the resource enforces mathematical precision within a scientific context. Research emphasizes that "writing about data" is a critical component of the gradual release of responsibility, reflected in the final forecast question. This dual-modal approach—combining numerical recording with narrative description—ensures a holistic understanding of weather patterns while meeting national standards for science inquiry and data literacy skills.