These bar graphs worksheets pdf for 2nd grade give teachers a print-ready set of resources that covers the full arc of the 2nd-grade data standard — from reading a finished graph to building one from scratch and then solving comparison problems based on the data. Every worksheet uses single-unit scales and stays within four categories, which keeps the work squarely in the 2.MD.D.10 band before students encounter scaled graphs in 3rd grade.
The Specific Skills Targeted Across the Set
A well-sequenced collection of bar graphs worksheets pdf for 2nd grade separates task types rather than bundling them, so teachers can assign based on where students actually are rather than marching through a fixed sequence every time. The four core skills addressed across the set are:
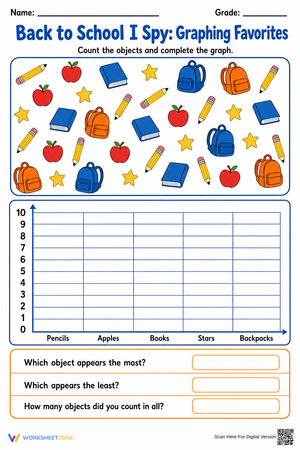
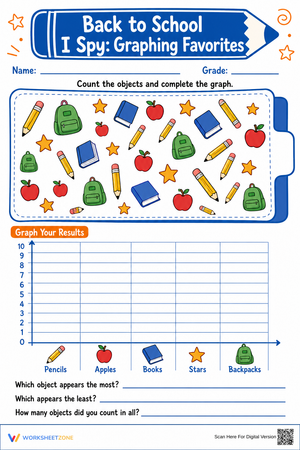
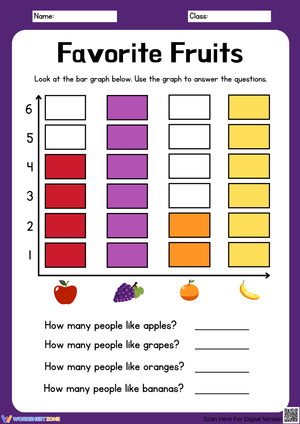
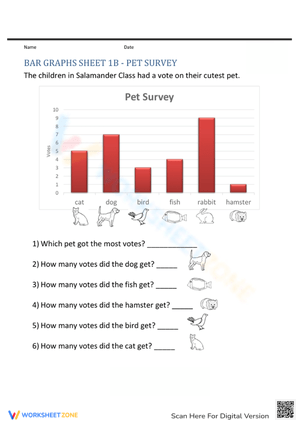
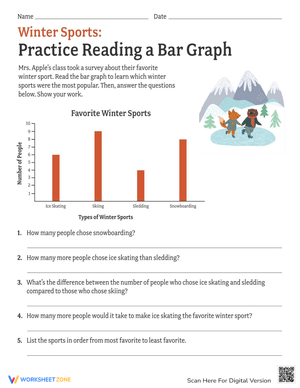
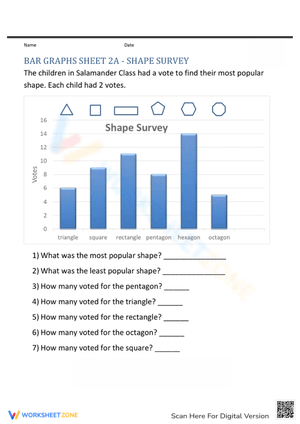
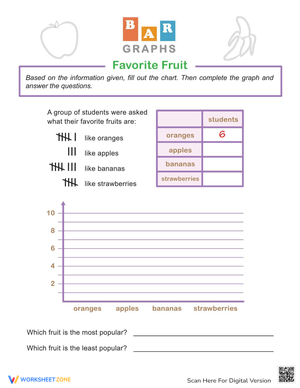
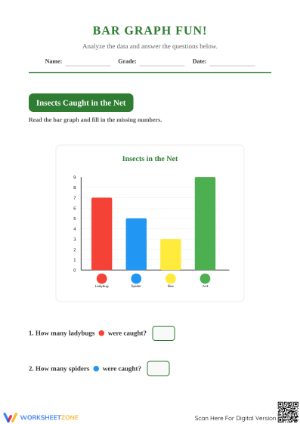
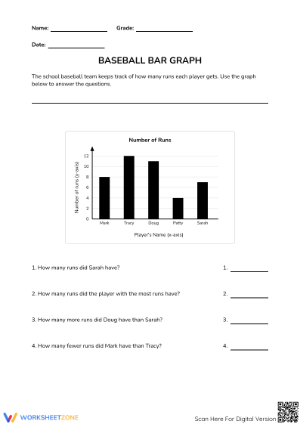
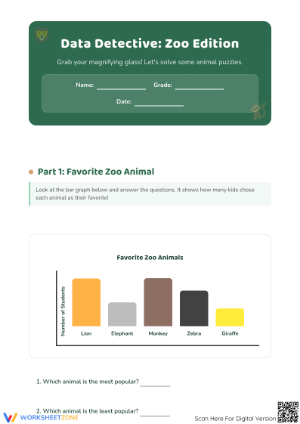
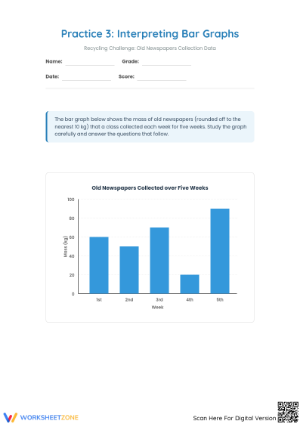
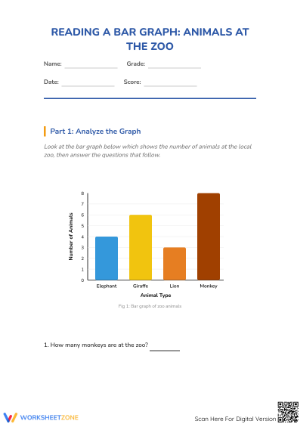
- Graph interpretation: Students read a completed bar graph and answer literal questions — which category has the most entries, which has the fewest, what the total is across all categories.
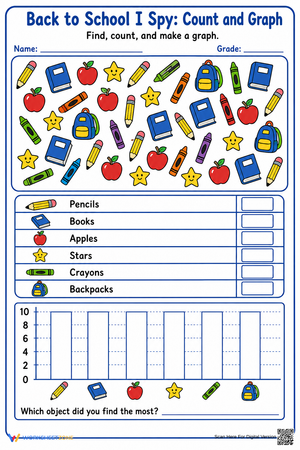
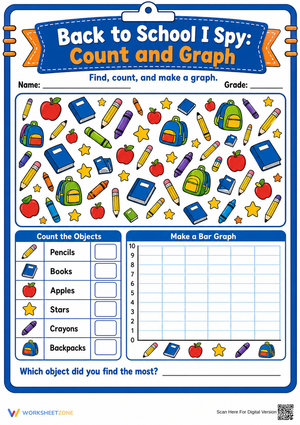
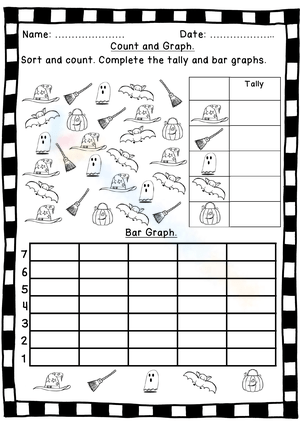
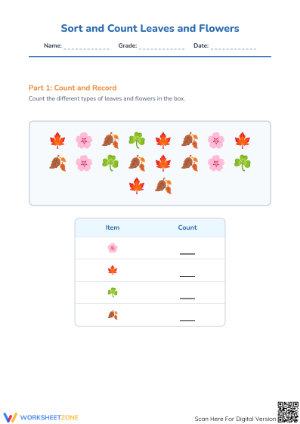
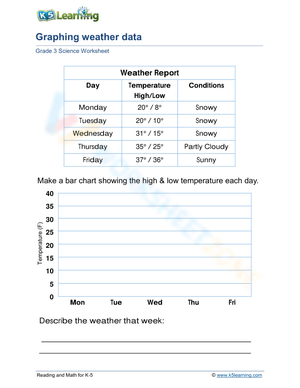
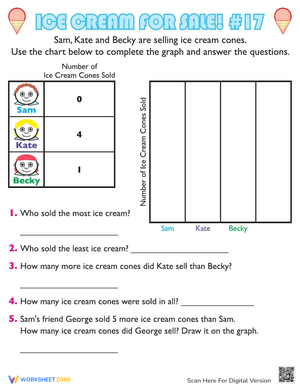
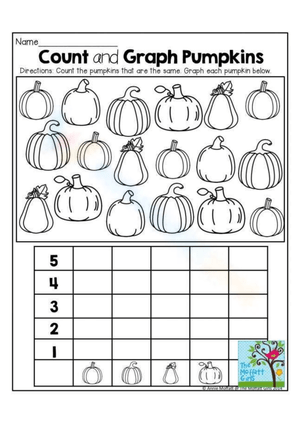
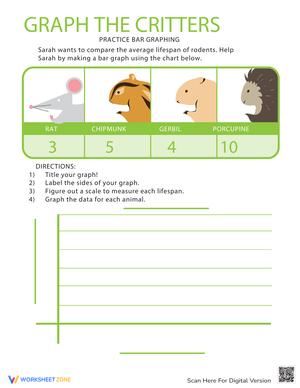
- Tally-to-graph construction: A tally chart is provided; students draw the corresponding bars, write a title, and label both axes.
- Graph anatomy: Students identify or supply missing parts — a blank title line, an unlabeled axis, a scale that doesn't start at zero — and correct the problem.
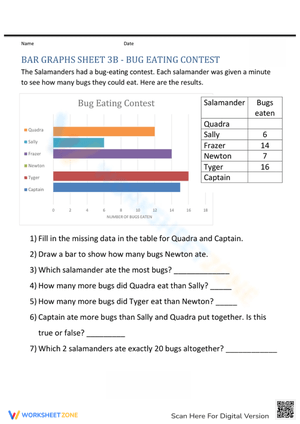
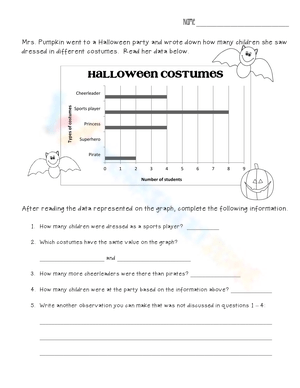
- Comparison problems: Students answer "how many more" and "how many fewer" questions, which require subtraction from values read directly off the graph.
Thematic contexts rotate across school-familiar topics: classroom pets, weather tallies, lunch choices, types of shoes. Keeping the subject matter recognizable lets students direct their attention toward the graphing task rather than decoding an unfamiliar scenario first.
Where Students Consistently Go Wrong With Bar Graphs
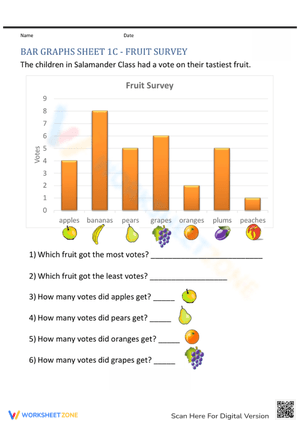
The comparison question format surfaces the most instructive error in this unit. A student who reads both bar values accurately — 7 for apples, 4 for oranges — will still write 11 as the answer to "how many more students chose apples?" The bar graph worked; the breakdown happens in the next cognitive step. When you see addition as the answer to a difference question, the student needs a physical bridge before returning to paper: line up two towers of snap cubes side by side, remove the matching portion, and count what's left. That concrete step is often the only thing standing between confusion and clarity.
A quieter construction error appears when students start their bars above the zero baseline. They see that their lowest data value is 3 and begin drawing the bar at the 3 mark rather than at the bottom of the grid. The finished graph looks reasonable at a glance but misrepresents every quantity. These worksheets use grid paper with a clearly marked zero baseline on every construction task, which removes the visual ambiguity — though the teaching conversation still needs to happen out loud.
Labeling omissions are nearly universal in the first two weeks. Students finish the bars and flip the worksheet over without writing a title or axis labels. A short graph checklist — title, category labels, number scale, bars filled in — posted at the table and reviewed before any worksheet is handed in closes that habit gap faster than any after-the-fact reminder.
Fitting These Worksheets Into Your Lesson Cycle
The interpretation worksheets work well as Monday warm-ups during morning meeting, before formal instruction begins. Projecting the graph and walking through the questions together gives you an informal read on where the class stands before you commit to a lesson direction. Five minutes at the start of the week can shift the entire week's plan.
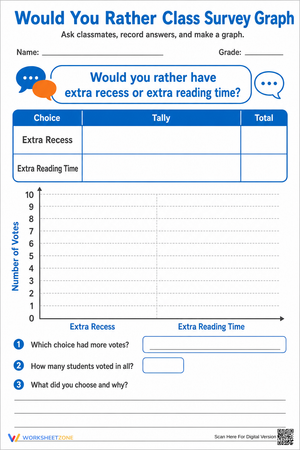
Construction worksheets land better when students bring their own data to the task. Spend the first ten minutes of the math block running a quick class survey — favorite fruit, how they got to school, number of siblings — then hand out the construction worksheet. Students graph what they actually collected rather than an invented scenario, and that difference in ownership improves label completion noticeably. The data feels like theirs, so the graph does too.
Comparison worksheets make clean exit tickets. They take five to seven minutes, require students to show their subtraction work alongside the graph reading, and produce sorted formative data — who subtracted correctly, who added instead, who misread the scale — that shapes the next day's small-group work directly.
Standard Alignment
CCSS.MATH.CONTENT.2.MD.D.10 asks students to draw a picture graph and a bar graph with single-unit scale to represent a data set with up to four categories, and to solve put-together, take-apart, and compare problems using information presented in those graphs. The construction worksheets address the drawing requirement directly. The interpretation and comparison worksheets address the problem-solving component — the part of the standard teachers most commonly underweight because the drawing portion is more visible during independent work time. Because bar graphs worksheets pdf for 2nd grade cover both halves of the standard, they reveal whether students can actually use a graph to reason, not just whether they can produce one.
This standard sits in the Measurement and Data domain and feeds directly into CCSS.MATH.CONTENT.3.MD.B.3, where students draw scaled bar graphs and solve multi-step comparison problems across several categories. Students who leave 2nd grade uncertain about single-unit scale arrive at that 3rd-grade standard without the grounding they need.
Tiering the Work for Students at Different Points in the Standard
Because the task types in these bar graphs worksheets pdf for 2nd grade span interpretation, construction, anatomy, and comparison, teachers can tier the work without preparing separate materials from scratch. For students still working on number recognition and one-to-one correspondence, the pre-made interpretation worksheets remove the construction burden entirely. Pre-numbering the scale and limiting questions to literal retrieval — "how many students chose cats?" — keeps the cognitive load manageable while still giving students meaningful contact with graph structure.
Students who move through interpretation quickly benefit from open-ended construction tasks: a blank graph template, a topic, and the direction to collect data from four classmates. They handle the full pipeline — collecting, tallying, drawing, labeling — and then write two comparison questions for a partner to answer. That extension turns each worksheet into a launching point for real mathematical conversation rather than a task to finish and set aside.
For students who consistently stall when writing numbers on the scale themselves, providing a pre-printed scale removes that one friction point. The graphing work remains intact — they still read and draw bars against the same numbered axis — but the lesson doesn't collapse into a number-writing lesson when that was never the teaching objective.
Frequently Asked Questions
What is the difference between a picture graph and a bar graph, and when should I make the transition in 2nd grade?
In 1st grade, students work with picture graphs where each symbol stands for exactly one item. In 2nd grade, the expectation shifts to bar graphs, where a solid bar's length represents the quantity. The clearest transition technique is showing the same data in both formats side by side: five symbols in a picture graph become a bar that reaches the 5 line on a bar graph. Once students see that equivalence, the bar stops feeling arbitrary and starts feeling like a more efficient version of what they already know.
My students draw the bars correctly but skip the title and axis labels every time — how do I fix that?
This is a habit gap, not a comprehension gap. Build a four-item graph checklist — title written, horizontal axis labeled, vertical axis labeled, all bars filled in — into your classroom routine. Have students run through it before handing any graphing worksheet in. Students who check their own work against a concrete list internalize the structure faster than students who are simply reminded after they've already finished and moved on.
How do bar graphs connect to addition and subtraction skills at this grade level?
Interpretation worksheets embed arithmetic in a purposeful context. When students find the total number of items across all categories, that's multi-addend addition. When they answer a "how many more" question, that's subtraction — finding the difference between two values on the scale. Students who disengage from bare computation problems will often stay with the same operations when the numbers belong to a graph they've read themselves.
Why do students practice both vertical and horizontal bar graph orientations?
A student who works only with vertical graphs can develop the assumption that bars always go upward and the number scale always runs along the left side. Horizontal graphs require that student to reassign which axis carries the scale and which carries the category labels. That reassignment is low-stakes at the 2nd-grade level, but it builds the flexible reading habit that standardized assessments test — and that every data context students encounter beyond this grade will demand.