


Views
Downloads
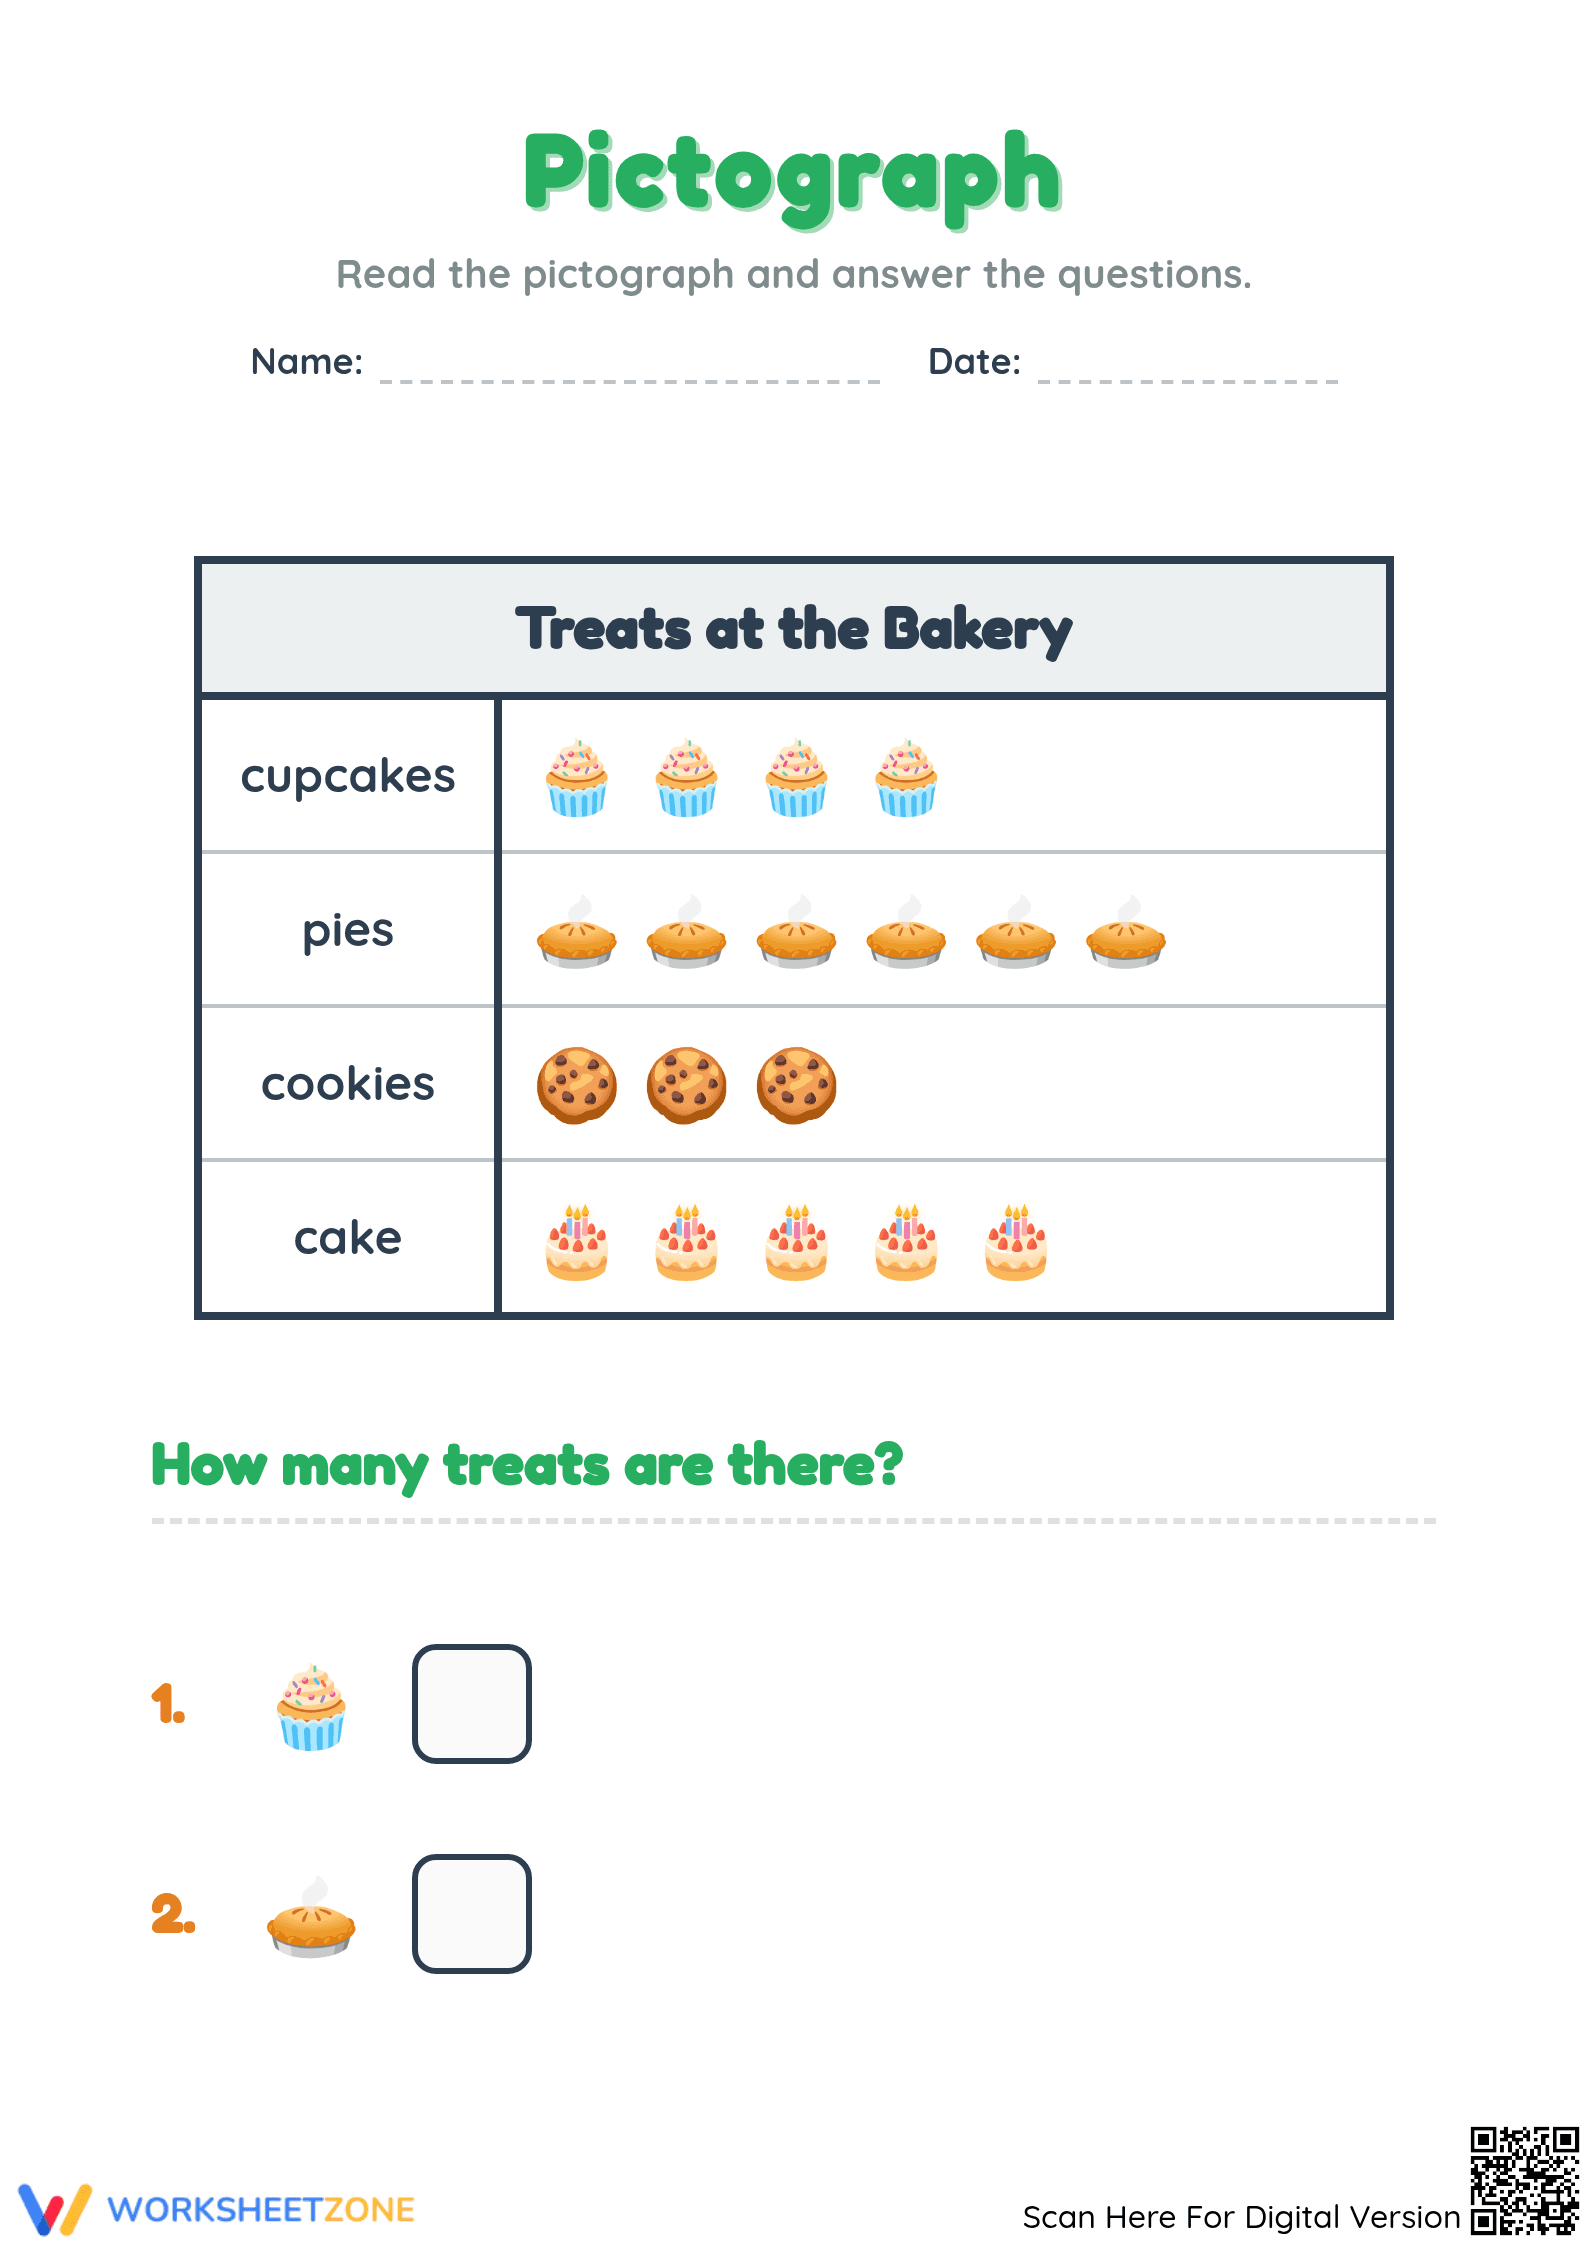
Essential Pictograph DJ Worksheet | Grade 1 Math Aligned
Paste this activity's link or code into your existing LMS (Google Classroom, Canvas, Teams, Schoology, Moodle, etc.).
Students can open and work on the activity right away, with no student login required.
You'll still be able to track student progress and results from your teacher account.
Master data interpretation with this Pictograph DJ worksheet for Grade 1. This resource focuses on reading pictographs where each symbol represents two items, providing a foundation for graphing and skip-counting skills essential for early mathematical development and data-driven literacy. Students will engage with a music-themed dataset to build confidence in analytical thinking.
At a Glance
- Grade: 1 · Subject: Math
- Standard:
CCSS.MATH.CONTENT.1.MD.C.4— Organize, represent, and interpret data with categories and answer questions about data points.- Skill Focus: Interpreting scaled pictographs
- Format: 3 pages · 10 problems · Answer key included · PDF
- Best For: Independent practice and small group instruction
- Time: 15–25 minutes
What's Inside
This 3-page PDF includes a focused worksheet and a full answer key. The activity features a music-themed pictograph with ten targeted questions spread across two pages. Students apply the "1 record = 2 songs" key to interpret categories like Rock, Pop, and Country, performing basic addition or comparison to find total values and answer data-driven prompts accurately.
Skill Progression
- Guided practice: Students identify the key to understand one record represents two songs. Initial questions focus on reading direct values from single categories.
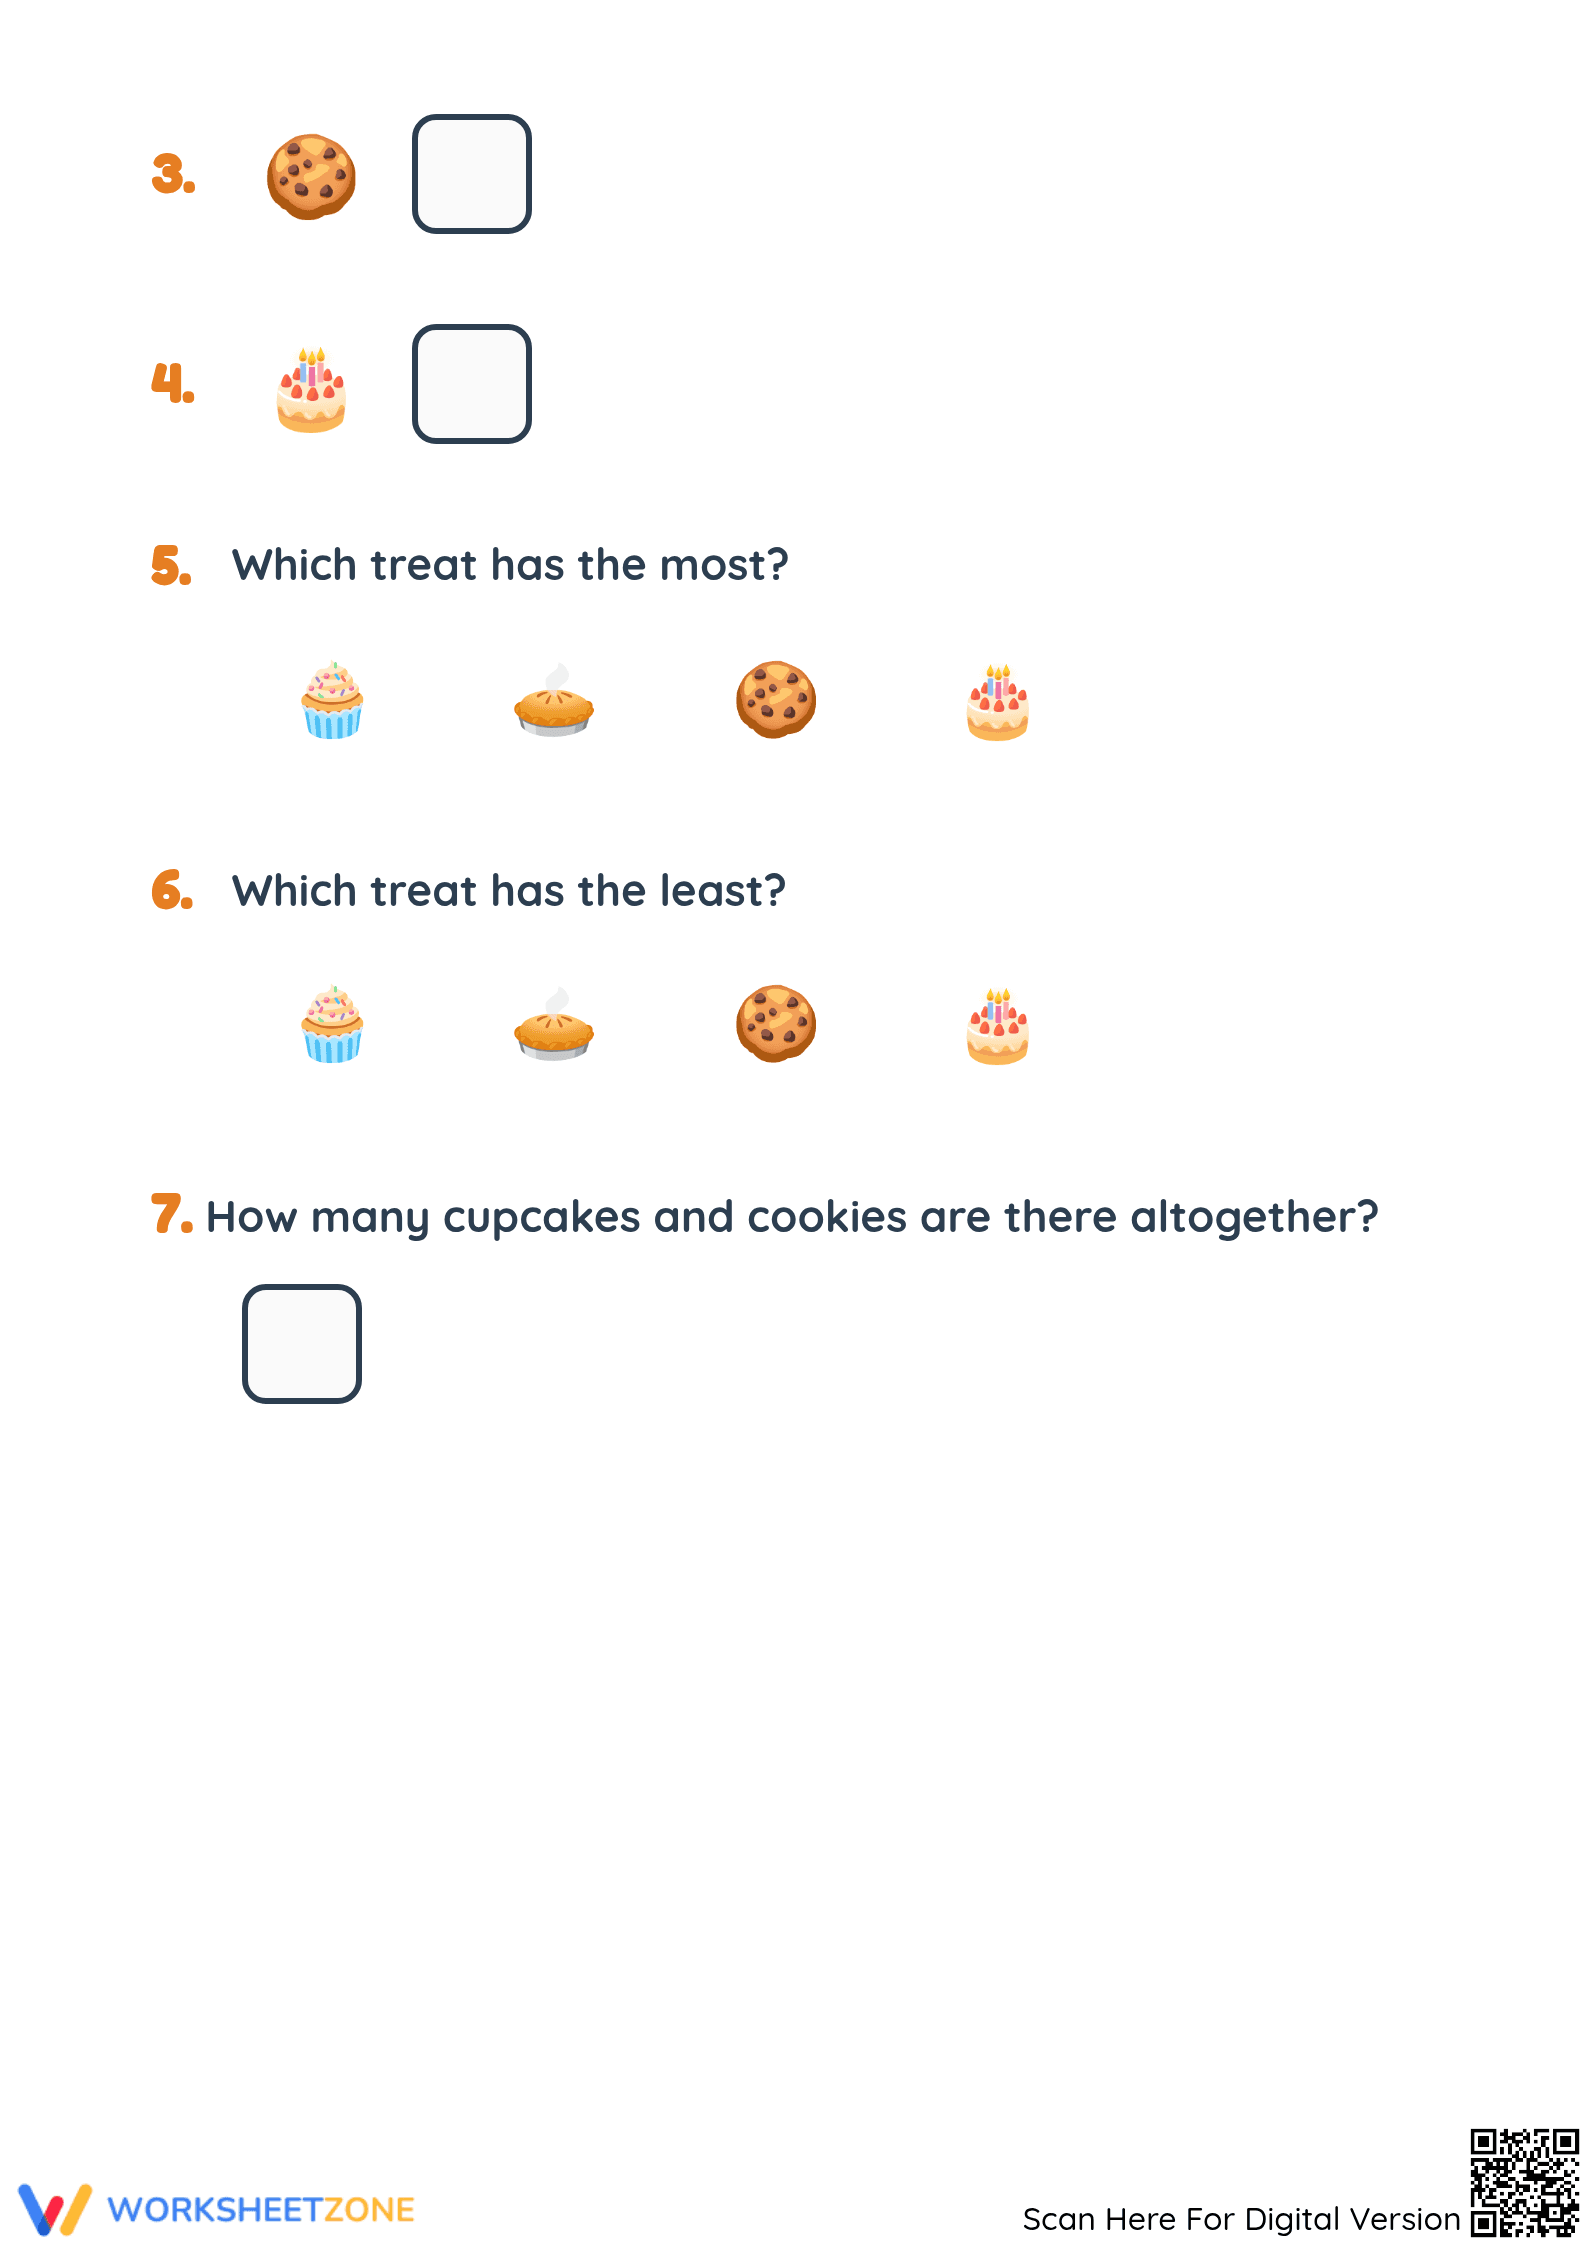
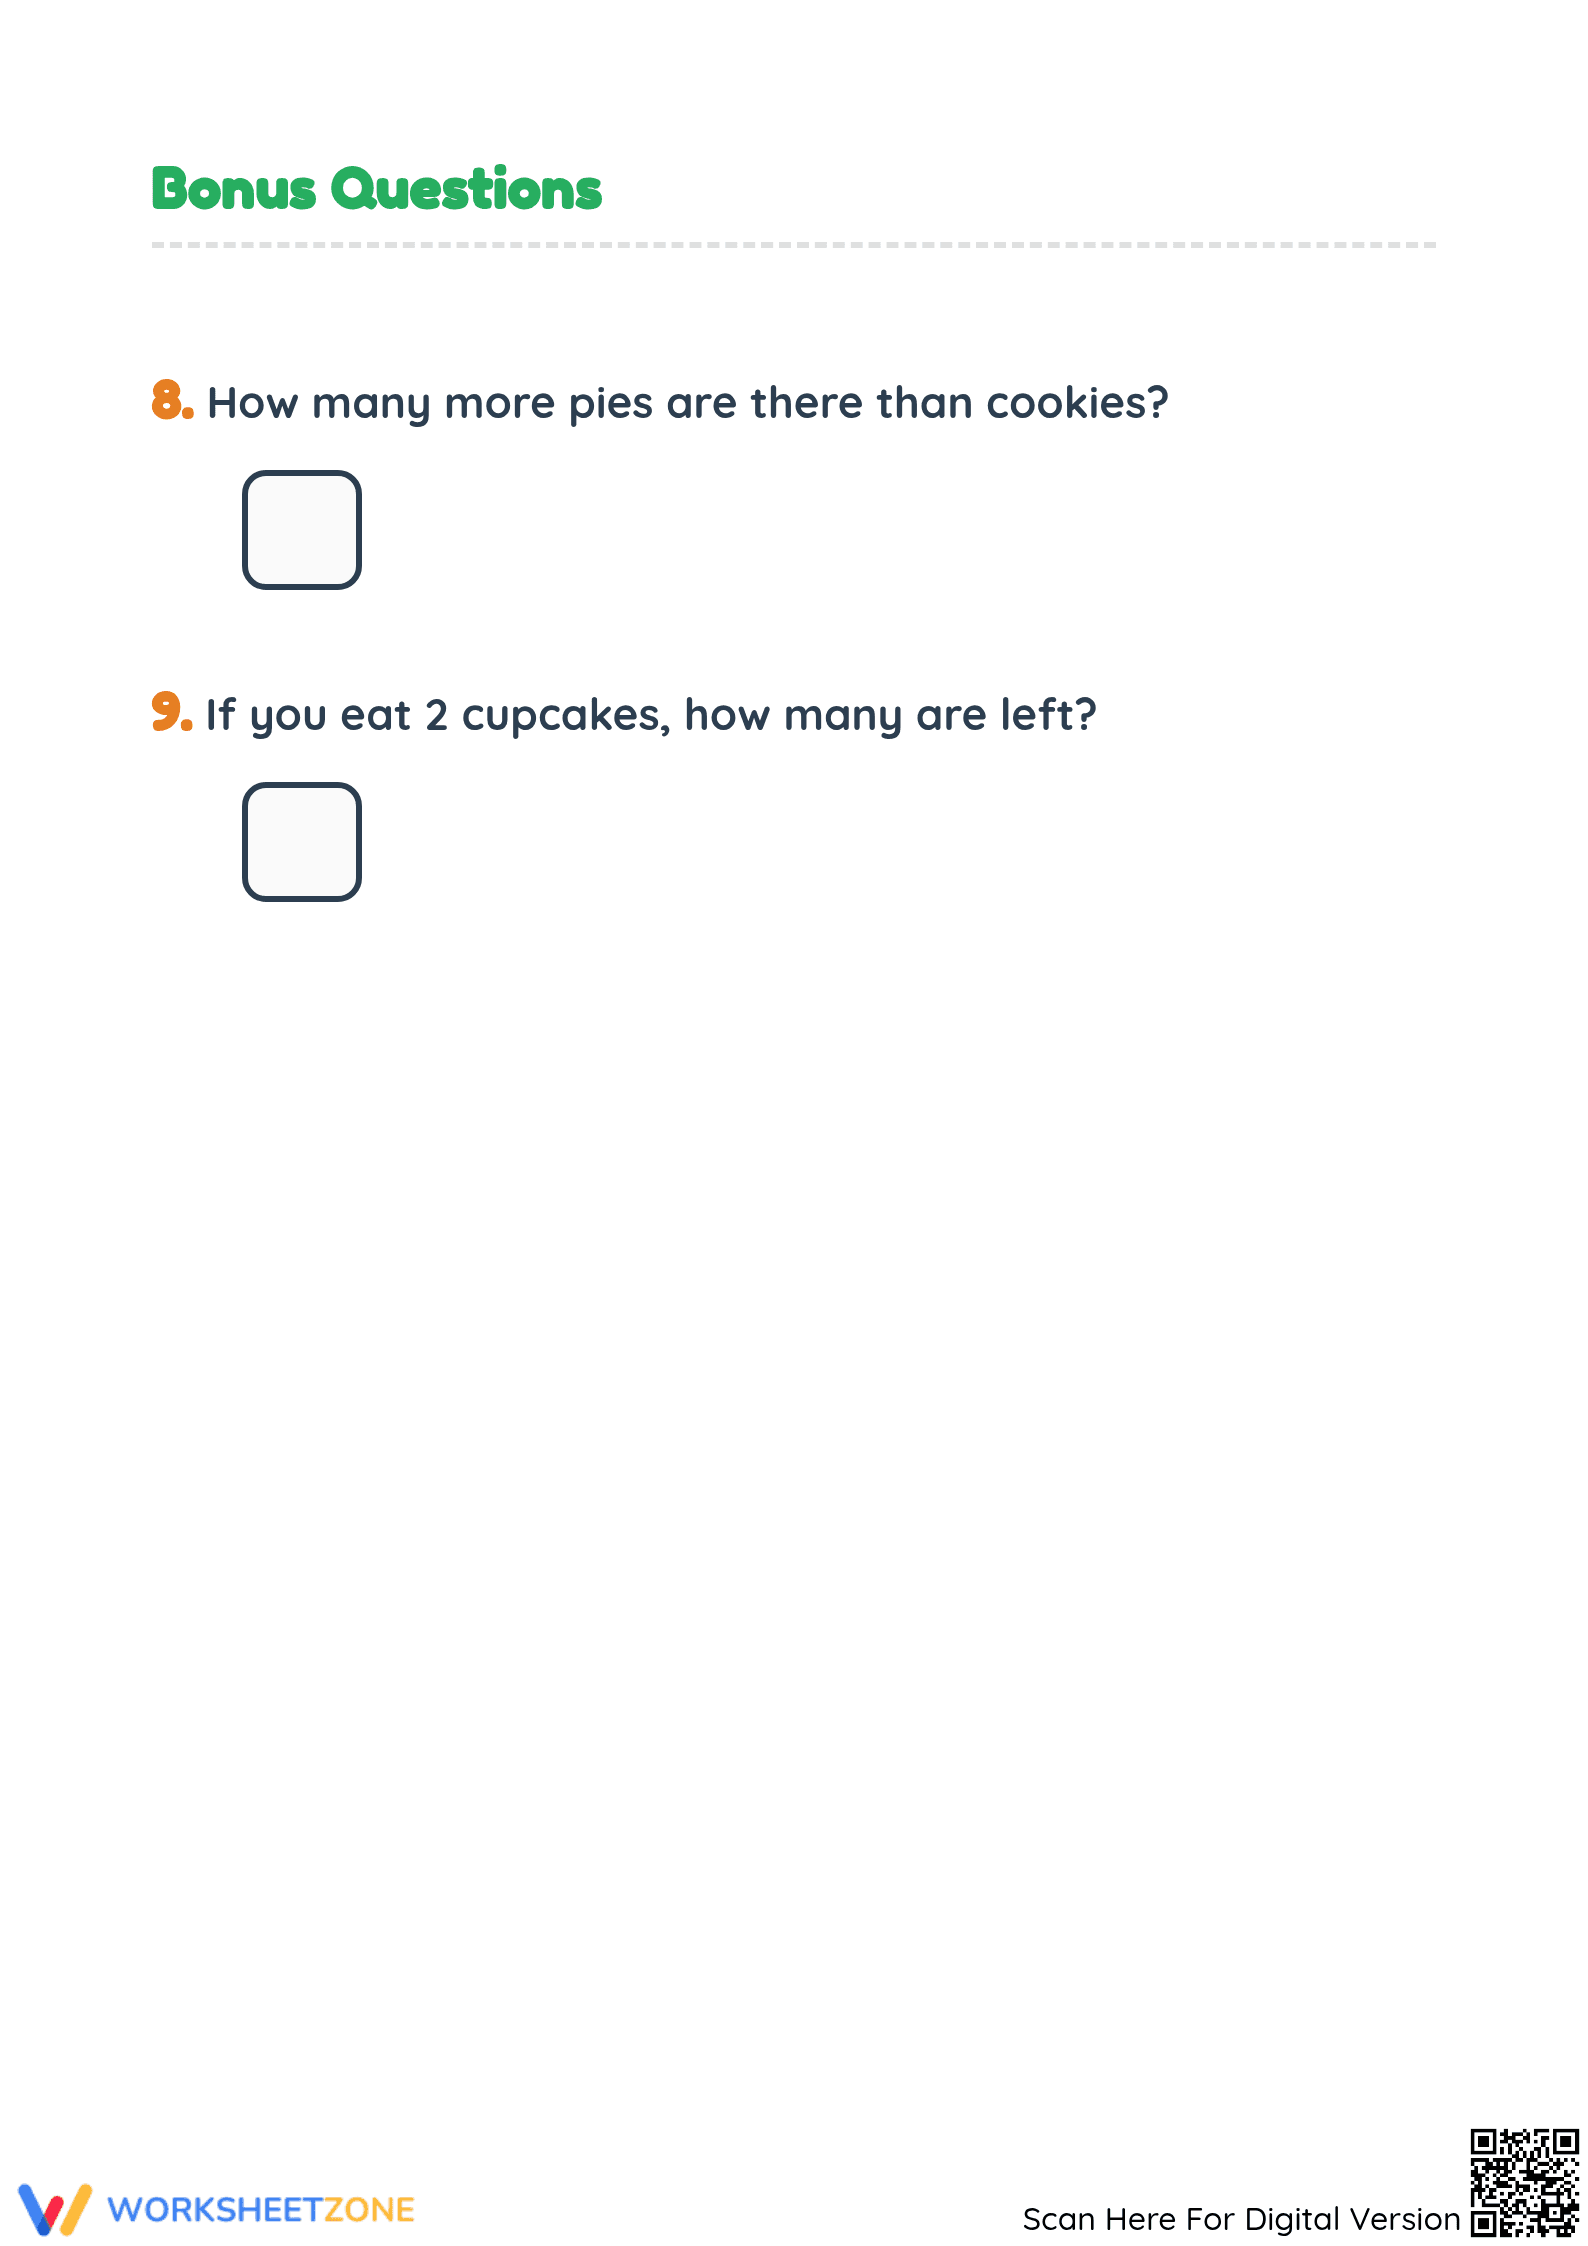
- Supported practice: Tasks require comparing categories, such as identifying which genre has more songs or calculating differences between specific music styles.
- Independent practice: Final problems challenge students to synthesize data by calculating grand totals based on the graph's evidence.
This follows the gradual-release model, moving from simple identification to higher-order data analysis.
Standards Alignment
This resource aligns with `CCSS.MATH.CONTENT.1.MD.C.4`. Students interpret data with categories and answer questions about totals and comparisons. It serves as an excellent extension for first graders or a review for second graders transitioning to scaled graphs. Both standard codes can be copied directly into lesson plans, IEP goals, or district curriculum mapping tools.
How to Use It
Use this as a formative assessment during your graphing unit. It is effective after teaching pictograph keys. Observe students to ensure they apply the key (2 songs) instead of counting icons. Expect completion in 15-20 minutes. It works well as an exit ticket or an independent practice station during math rotations for immediate data feedback.
Who It's For
This is ideal for Grade 1 students ready for scaled graphs. It serves as a remedial tool for Grade 2 or a fast-finisher activity. Pair this with physical manipulatives to provide concrete support for learners who struggle with abstract scaled symbols. It is perfect for diverse classrooms requiring visual data support and structured math practice.
Data interpretation is vital for early literacy. Pictographs provide a visual bridge between counting and abstract analysis. According to RAND AIRS 2024, students engaging in regular "math-talk" around visual data demonstrate higher retention of comparison logic. This worksheet addresses `CCSS.MATH.CONTENT.1.MD.C.4` by requiring students to interpret data within categories, expanding their ability to organize and answer questions. By utilizing a scaled key of 2, the "Pictograph DJ" worksheet introduces the concept of representation leading into multiplication and complex graphing standards. Educators can rely on this structured practice to identify student misconceptions regarding scaled values early. It is a robust tool for evidence-based instruction in elementary settings.