These 2nd grade pictographs worksheets pdf resources give teachers printable, targeted practice across the full range of picture graph skills — reading completed graphs, interpreting comparison questions, and building graphs from raw data. Each worksheet isolates a specific skill rather than trying to cover everything at once, which makes it easier to slot them where a class actually needs them.
The Specific Skills These Worksheets Target
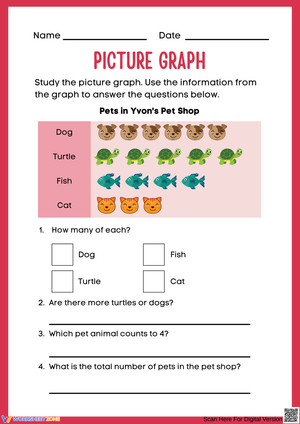
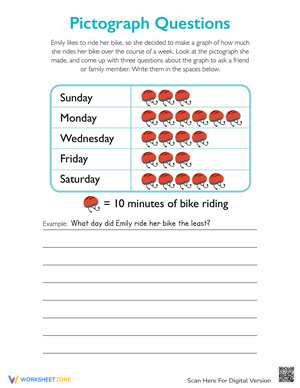
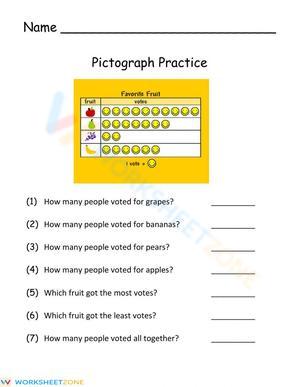
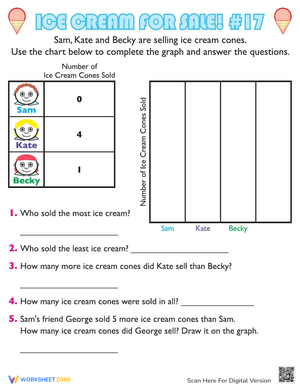
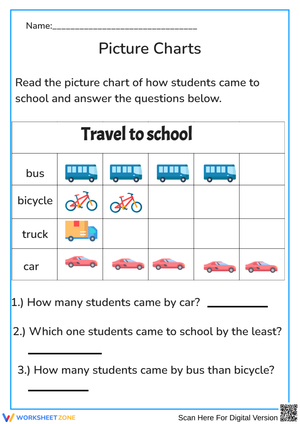
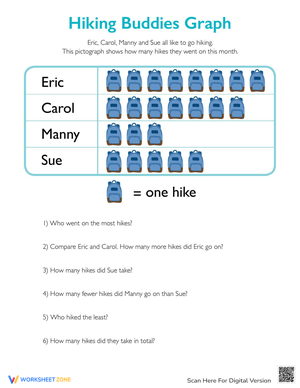
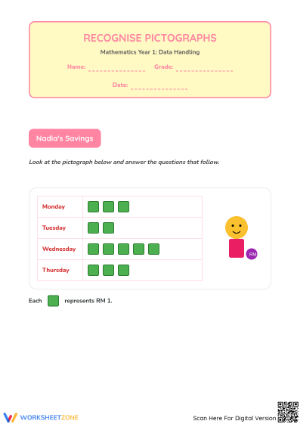
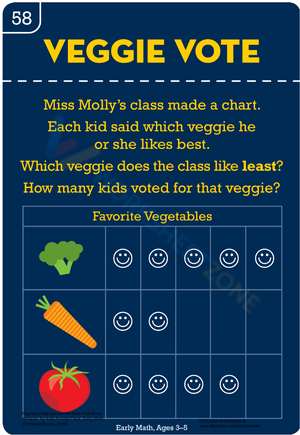
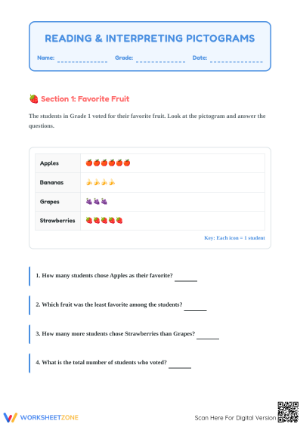
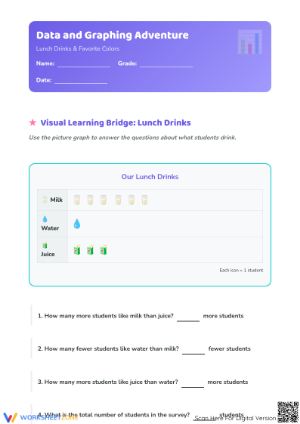
The set moves through picture graph work in a logical sequence. Early worksheets ask students to read a completed pictograph and answer literal questions: how many items are in a given category, which category has the most, which has the fewest. These questions build familiarity with the graph's structure before introducing anything harder.
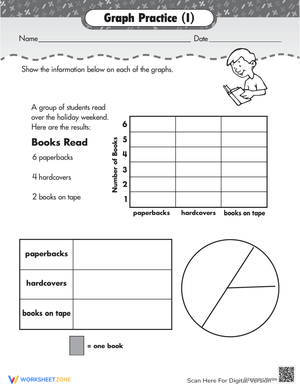
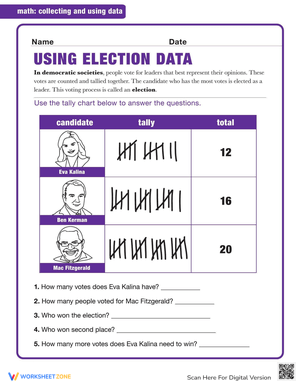
Later worksheets shift to comparison problems — "how many more" and "how many fewer" — which require students to subtract one category's total from another rather than simply counting. Additional worksheets ask students to build a pictograph from a provided tally chart, write a title, and fill in the key. The full list of skills across the set:
- Reading a pre-made pictograph and answering literal quantity questions
- Identifying the category with the greatest or least count
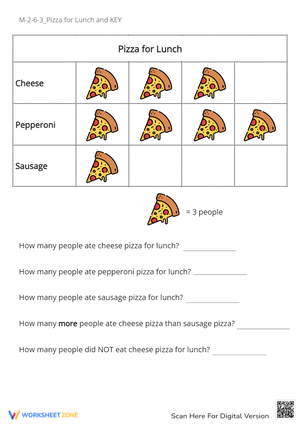
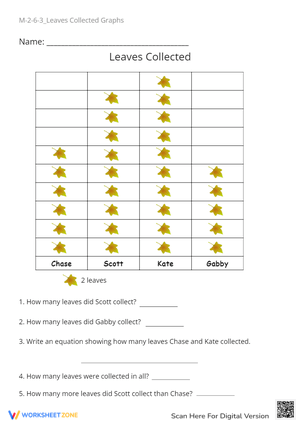
- Solving "how many more" and "how many fewer" comparison problems
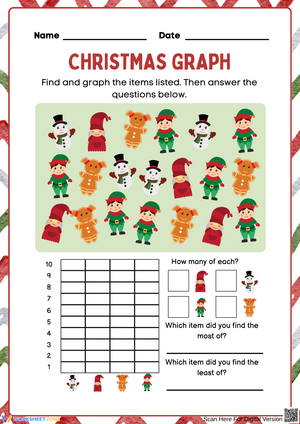
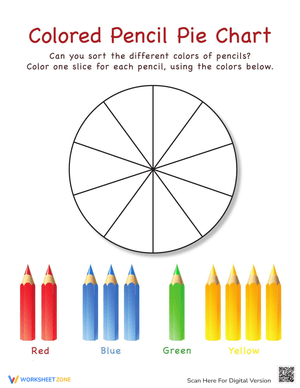
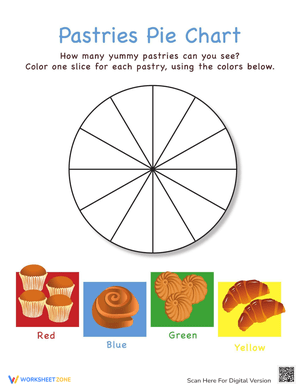
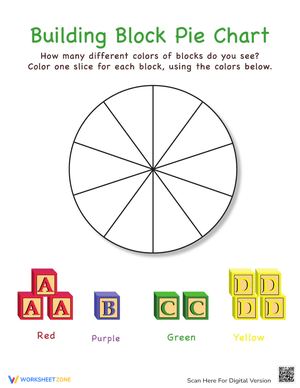
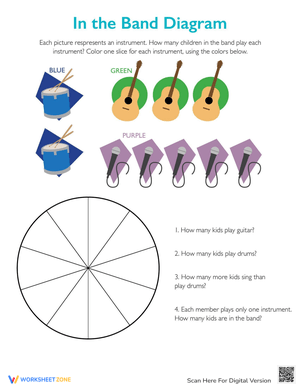
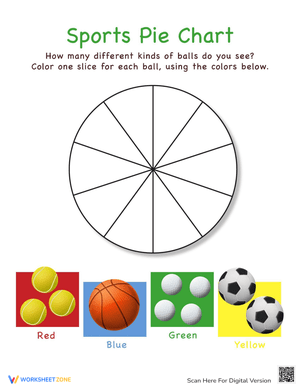
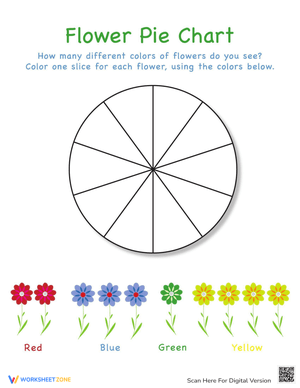
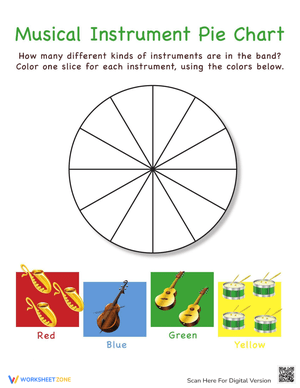
- Converting a tally chart into a completed pictograph
- Writing a graph title and completing a key with a single-unit scale
- Aligning symbols consistently within rows or columns
Mistakes Students Make That These Worksheets Help Teachers Catch
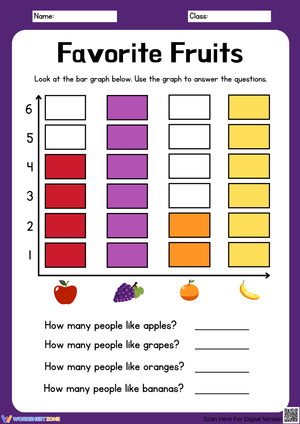
The most consistent error in actual student work is answering a comparison question with a row total instead of a difference. A student looks at 6 apple symbols and 4 orange symbols, reads "how many more apples than oranges?", and writes "6." They counted correctly — they just didn't recognize that the question calls for subtraction. This is not a graphing misunderstanding; it is a reading-the-question problem that gets surfaced by pictograph work because students are managing symbol-counting at the same time they are parsing question language.
A second pattern worth watching: students who draw symbols of noticeably different sizes on the same row. They often argue the graph is correct because their count is right, and technically they are not wrong — but the visual logic of a pictograph depends on uniformity. A large smiley face next to a small smiley face implies different values to most readers. Pointing this out explicitly, rather than just marking it wrong, is the teaching moment.
Students also routinely skip the key. They assume each symbol always equals one item and never glance at the legend, which causes no visible harm at the 2nd grade level but becomes a serious problem the moment a half-symbol key appears. The worksheets make key-checking a required step in every question set, which builds the habit before it actually matters.
Standard Alignment
CCSS 2.MD.D.10 requires students to draw a picture graph and a bar graph with a single-unit scale to represent a data set with up to four categories. The standard also expects students to solve put-together, take-apart, and comparison problems using information from the graph. In classroom terms, that means students need two distinct competencies: the mechanical skill of constructing a graph accurately, and the interpretive skill of extracting answers from a finished one. The 2nd grade pictographs worksheets pdf set addresses both as separate skill layers — reading tasks come before drawing tasks — which reflects how the standard is typically sequenced in 2nd grade math units.
How to Build These Worksheets Into Your Lesson Plans
The most effective move before any pictograph worksheet is having students build a physical graph on their desks using manipulatives — colored tiles, small cubes, or sticky notes — before they put pencil to paper. The act of placing one tile per data point and arranging tiles into rows makes one-to-one correspondence visible in a way that looking at pre-printed symbols does not. Students who do this step make fewer symbol-spacing errors on the worksheet that follows.
For morning warm-up, one worksheet with a pre-made graph and three comparison questions takes about six minutes — enough to settle the room during attendance and give a teacher a fast read on who still needs support before the formal lesson begins. These work equally well as exit tickets: a single worksheet with one graph and two or three interpretive questions tells a teacher exactly where to start the next day. The 2nd grade pictographs worksheets pdf resources also fit naturally into math centers, where small groups collect their own survey data and then use a blank-graph worksheet to record and display it — a task that makes data collection feel purposeful rather than abstract.
Adjusting the Set for a Range of Learners
For students who are still working toward fluency, narrow the task to literal reading questions only — how many, which is most, which is least — before introducing any comparison problems. Providing a number line at the bottom of each worksheet gives them a concrete tool for the subtraction that comparison questions require, without turning the activity into a computation exercise. That separation keeps the focus on the graphing skill itself.
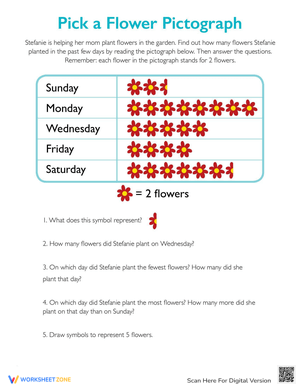
Students who have already mastered single-unit-scale reading benefit from half-symbol problems, where each symbol represents two items. This is not a formal 2nd grade standard expectation, but it is an honest extension of the skill and a direct preview of the scaled bar graph work students will encounter in 3rd grade. The 2nd grade pictographs worksheets pdf format — with its clear symbol rows and explicit key — makes that extension easy to set up by simply changing the key value and asking students to reinterpret the same graph at a higher level.
Frequently Asked Questions
What is the key on a pictograph, and why do so many 2nd graders ignore it?
The key explains what each symbol in the graph represents — in most 2nd grade graphs, one symbol equals one item. Students ignore it because, at this level, the key almost always says "= 1," so checking it feels unnecessary. The habit matters because it will not always say that. Building the routine of reading the key before counting anything is the real instructional goal, not just getting the right answer on any single worksheet.
How many categories should a 2nd grade pictograph include?
CCSS 2.MD.D.10 specifies up to four categories, and that ceiling is pedagogically sound. Four categories give enough data for meaningful comparison questions without overwhelming students who are simultaneously managing symbol-counting, row alignment, and question interpretation. Starting with two or three categories makes sense early in a unit; moving to four is appropriate once students are constructing their own graphs with confidence.
When should I introduce "how many more" comparison questions?
After students can accurately read a pictograph and answer literal quantity questions without hesitation. The comparison question adds a layer of language interpretation on top of the reading skill — students have to recognize that "how many more" means subtract, not just report a count. Mixing both question types too early is a reliable way to produce the "6 apples instead of the difference of 2" error. Let literal fluency come first, then layer in comparison problems once reading the graph itself is automatic.