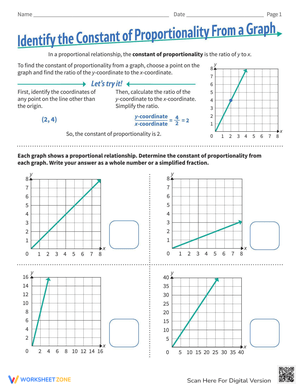
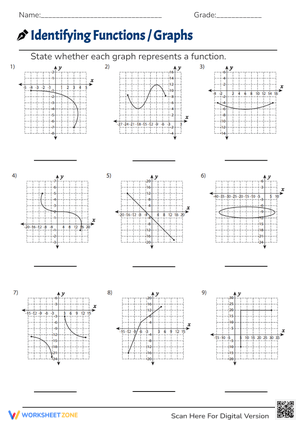
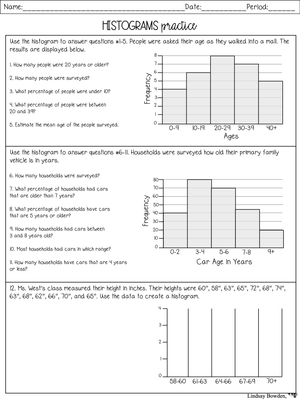
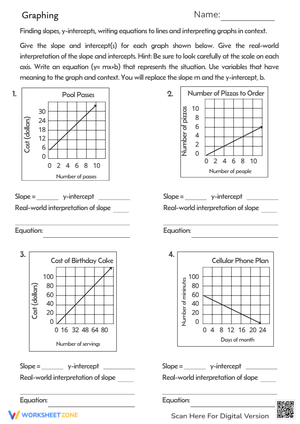
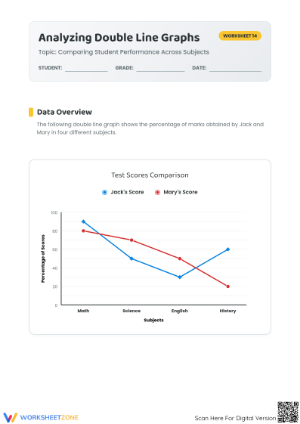
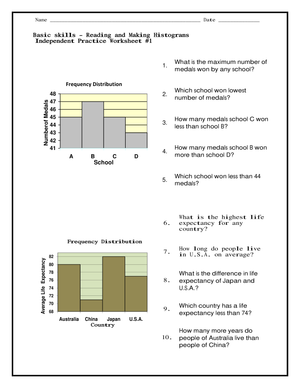
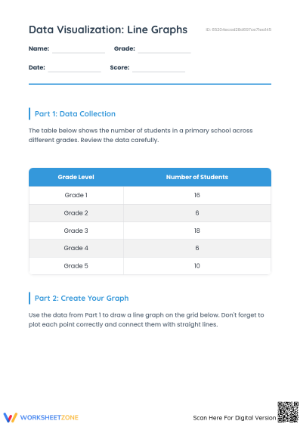
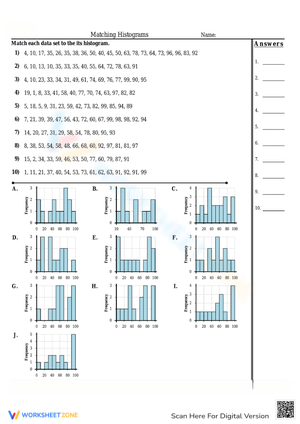
7th grade graphing data pdf worksheets give middle school math teachers a focused, repeatable way to move students from simply reading graphs to reasoning about what the data actually reveals. The jump between reading a bar graph in 4th grade and analyzing a box plot distribution in 7th is steep, and most students need repeated, varied practice at the construction, labeling, and interpretation stages before that reasoning becomes automatic. This set covers that range.
The Skills These Worksheets Build
Graphing in 7th grade is not a single skill — it's a cluster of decisions students make before they touch a pencil. They have to choose a graph type that fits the data, set up a scale that represents the range without distorting it, and then interpret what they've drawn by noticing trends, gaps, clusters, and outliers. Each of those steps breaks down differently for different students.
The worksheets target these specific moves:
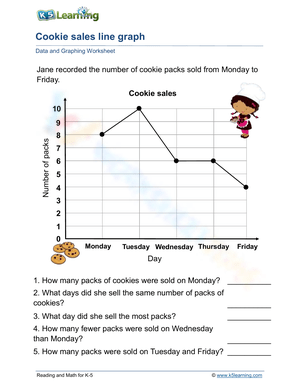
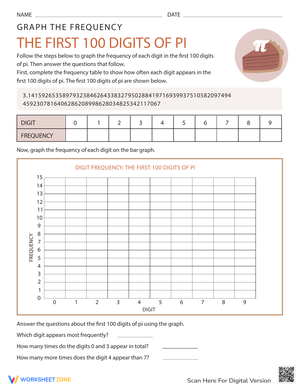
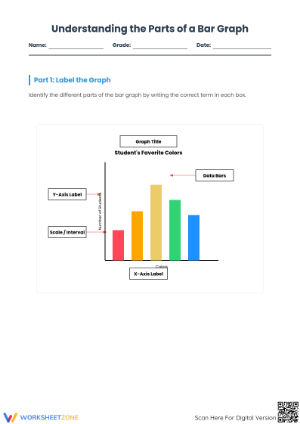
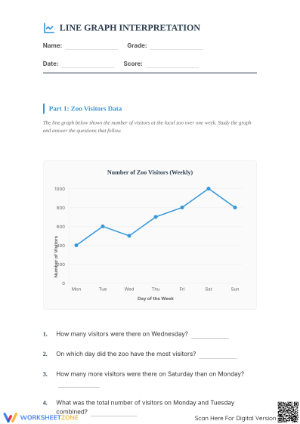
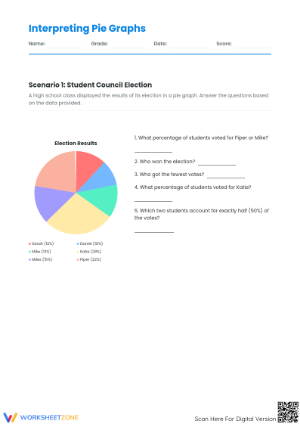
- Reading and creating bar graphs, line graphs, and circle graphs
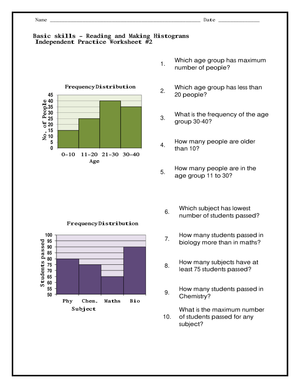
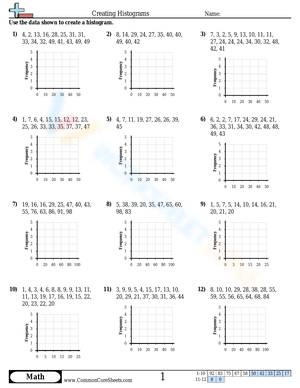
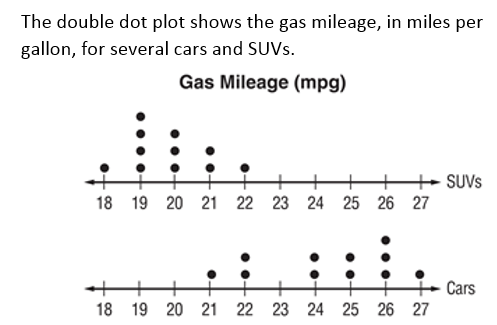
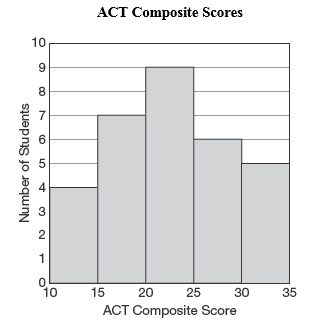
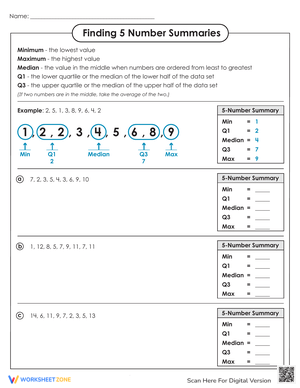
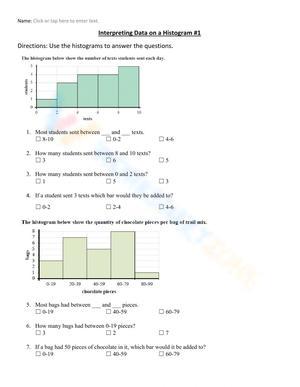
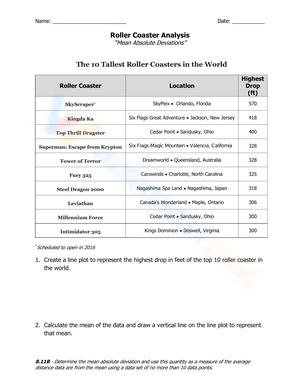
- Constructing and interpreting dot plots, histograms, and box plots
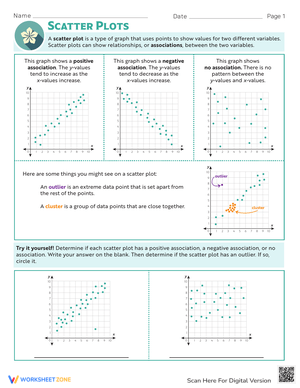
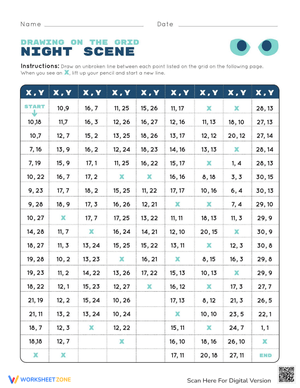
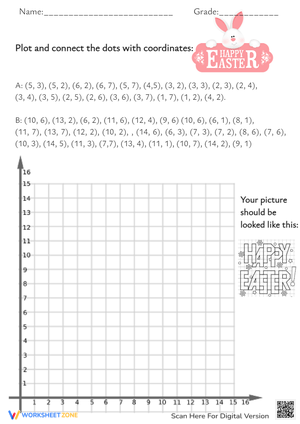
- Plotting ordered pairs and identifying patterns on the coordinate plane
- Choosing the most appropriate graph type for a given data set and defending that choice
- Setting intervals and scales that represent data honestly
- Labeling titles, axes, and units without prompting
- Writing interpretations that cite evidence from the graph rather than restate the question
That last point matters more than it gets credit for at this grade level. Students who can build a histogram from scratch will still answer an interpretation question by writing "the data shows sports" instead of noting where the distribution clusters or how spread out the values are. Interpretation practice has to be built in, not assumed.
Graph Types Worth Prioritizing at This Level
Dot plots, histograms, and box plots
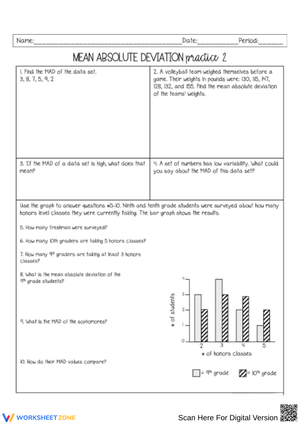
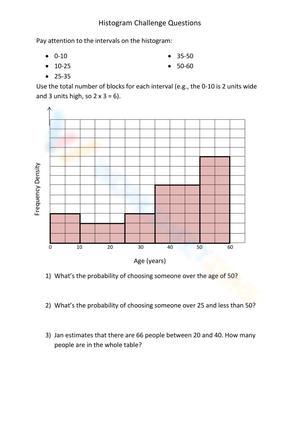
These three formats carry most of the instructional weight in 7th grade data work because they require students to think about distributions — where values cluster, how much spread exists, whether there are outliers. A histogram with unequal bars or a box plot with a compressed whisker generates better class discussion than a clean, symmetrical data set ever will. Students who only practice bar graphs and line graphs enter 8th grade unprepared for distribution-based analysis.
Line graphs and bar graphs
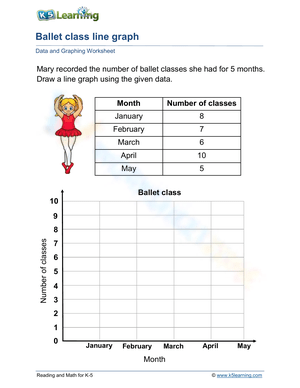
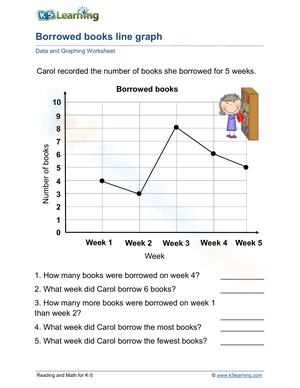
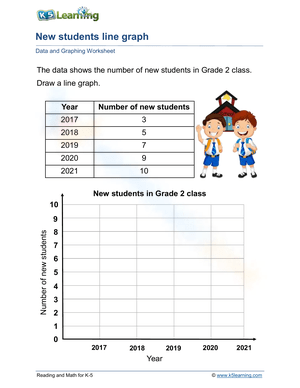
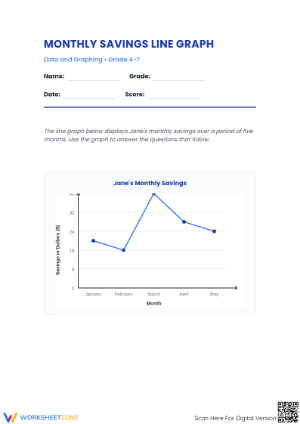
These appear early in the unit and throughout spiral review. Line graph practice is most productive when the table includes a time component and the interpretation questions ask about rate of change rather than just reading individual points. Bar graph tasks are more useful when students have to decide whether a bar graph or some other display makes more sense — not when the format is prescribed before the task begins.
Circle graphs and proportional displays
Circle graph work connects naturally to 7th grade ratio and percent content. Students who understand that each sector represents a portion of a whole transfer that reasoning to other proportional contexts. The common error here is treating small rounding differences between sector percentages as meaningful mistakes rather than artifacts of the display.
Mixed review
Mixed review worksheets — where the student has to identify the graph type before analyzing it — are the most reliable indicator of whether graphing reasoning has transferred. Students who have only practiced one graph type at a time often freeze when the format changes. Mixed review pushes them past pattern-matching into genuine decision-making, which is exactly what classroom assessments and state tests ask them to do.
Mistakes Students Make That These Worksheets Help You Catch
The most persistent error in 7th grade graphing is not forgetting a label — it's building an axis with inconsistent intervals and never noticing the problem. A student will write 0, 5, 10, 20, 30 on a y-axis and not register that the jump from 10 to 20 and then 20 to 30 is uneven, because the tick marks look evenly spaced on the page. That miscounting distorts every plotted value above 10, and the student submits it confident the graph is correct.
Other errors worth tracking across student work:
- Selecting a line graph for categorical data because it "looks more official"
- Plotting the first coordinate on the y-axis instead of the x-axis when working on the coordinate plane
- Answering interpretation questions with "the bar is tall" instead of reading the actual value from the scale
- Reading histogram frequencies as individual data values rather than as counts within intervals
- Placing the median line in a box plot based on visual estimation rather than the calculated middle value
A 30-second verbal check before students begin — have them name the graph type, the scale range, and what each axis will represent — eliminates a surprising number of these problems before they happen. Students who cannot answer those three questions fluently usually need a model before working independently. That brief exchange also gives the teacher a fast formative read on the whole room before everyone is already two minutes into the wrong scale.
Fitting These Worksheets Into Your Instructional Week
7th grade graphing data pdf worksheets work in almost any slot in the class period, but which worksheet you assign matters as much as when. A single-focus worksheet covering one graph type with a clean data set is the right move immediately after direct instruction, when students need to consolidate a new skill without competing demands. A mixed-format worksheet belongs later in the unit or at the start of a review week, when students are ready to shift between display types without teacher prompting.
Placement ideas that hold up in middle school math classrooms:
- Bell ringers: Two or three questions on scale reading or trend identification take about five minutes and reveal whether students retained the previous day's focus before new content begins.
- Station work: One station for graph construction from a table, one for interpretation only, one for error analysis — students rotate through all three and encounter the skill from different angles in a single period.
- Sub plans: A self-contained worksheet with a data table, graph space, and written response prompts works without any teacher setup and produces real work you can review on return.
- Friday review blocks: A 15–20 minute mixed-format review at the end of the week surfaces which display types students are still avoiding or misreading before the weekend interrupts the sequence.
- Small-group reteach: Printing the same worksheet for a targeted group during independent work time lets you sit with three or four students and walk through scale and labeling decisions in real time while the rest of the class works independently.
Standard Alignment
These worksheets align with CCSS 7.SP.A (using random sampling to draw inferences about a population), 7.SP.B (drawing informal comparative inferences about two populations), and 7.SP.C (investigating chance processes). In practical classroom terms, 7.SP.B is the standard most directly activated when students construct box plots or dot plots from two data sets and compare centers and spreads. Graphing is the vehicle through which students demonstrate statistical reasoning — without it, the understanding has nowhere to land visibly on paper.
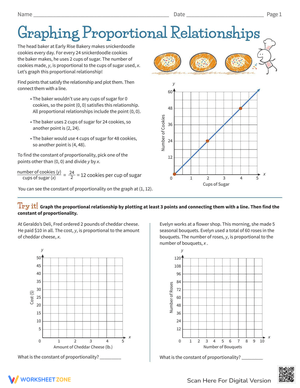
Line graphs and coordinate plane worksheets also connect to 7.RP.A.2, which asks students to recognize and represent proportional relationships. When students graph ordered pairs from a proportional table and read the unit rate from the resulting line, they are doing standards work in both the ratio and statistics domains at once — a pairing that makes graphing practice efficient for teachers with full units to cover.
Adjusting the Worksheets for a Range of Learners
Students who struggle with graphing often get stuck at the setup stage rather than the math itself. Providing a partially labeled axis — with the scale already written in and the title supplied — lets a student who is behind in organizational skills still practice plotting and interpreting at grade level without burning the whole period on setup. That's a different kind of support than simplifying the numbers; the data can stay at grade level while the structural pressure of building the display from scratch temporarily reduces.
For students who are ready for more challenge, the most productive move is not a harder data set — it's a messier one. Give them data with an outlier and ask whether to include or exclude it and what difference that makes to the graph shape. Ask them to critique a finished graph that uses a misleading y-axis. Ask them to take the same five numbers and argue whether a histogram or a box plot communicates the distribution more honestly. Those tasks extend reasoning without adding computation, and they reflect the kind of evaluative thinking that shows up on state assessments at the end of the year.
Across a mixed-level class, 7th grade graphing data pdf worksheets are most useful when the set includes both focused and open-ended tasks — students who need repetition work through the structured problems, while students who are ready for extension move to the comparative and evaluative questions without requiring a completely separate lesson plan.
Frequently Asked Questions
What graph types are most important for 7th grade data practice?
Box plots, dot plots, and histograms carry the most instructional weight at this level because they ask students to reason about distributions rather than read individual values. Bar graphs and line graphs remain relevant — especially for comparison and trend questions — but students who only practice those two formats arrive at 8th grade unprepared for the distribution analysis that follows.
Do these worksheets work for homework, or are they better used in class?
Both, depending on which worksheet you select. Focused single-format worksheets work well for homework because the task is clear and students are not making display-type decisions on their own without support. Mixed review and comparison tasks are better for class use, where you can observe where students hesitate, which questions they skip, and what wrong questions they ask about the data.
How can I tell whether a graphing worksheet is actually at the 7th grade level?
Look for tasks that require students to choose or justify a graph type, set their own scale, and write an interpretation that goes beyond restating what the axis shows. If every question on a worksheet can be answered by pointing at a number on a finished graph, the practice level is closer to 4th or 5th grade, regardless of what the header says.
Are these resources useful for state test preparation?
7th grade graphing data pdf worksheets give solid preparation for the data and statistics portion of state assessments when they include both construction and interpretation tasks. Assessment items at this level routinely ask students to analyze a graph, identify a misleading representation, or compare two distributions — not just extract a number from an axis. Worksheets that include those question types prepare students for the reasoning demands they will actually face on test day, not just the procedural ones.













 Interactive Worksheet Maker
 Quiz Maker
 Word Search Maker
 Crossword Puzzle Maker
 Word Scramble Generator
 Sentence Scramble Generator
 Handwriting Worksheet Generator
 Name Tracing Generator
 Fill In The Blank Generator