


























Views
Downloads

Interpreting Pie Graphs Worksheet | Grade 6 Essential
Paste this activity's link or code into your existing LMS (Google Classroom, Canvas, Teams, Schoology, Moodle, etc.).
Students can open and work on the activity right away, with no student login required.
You'll still be able to track student progress and results from your teacher account.
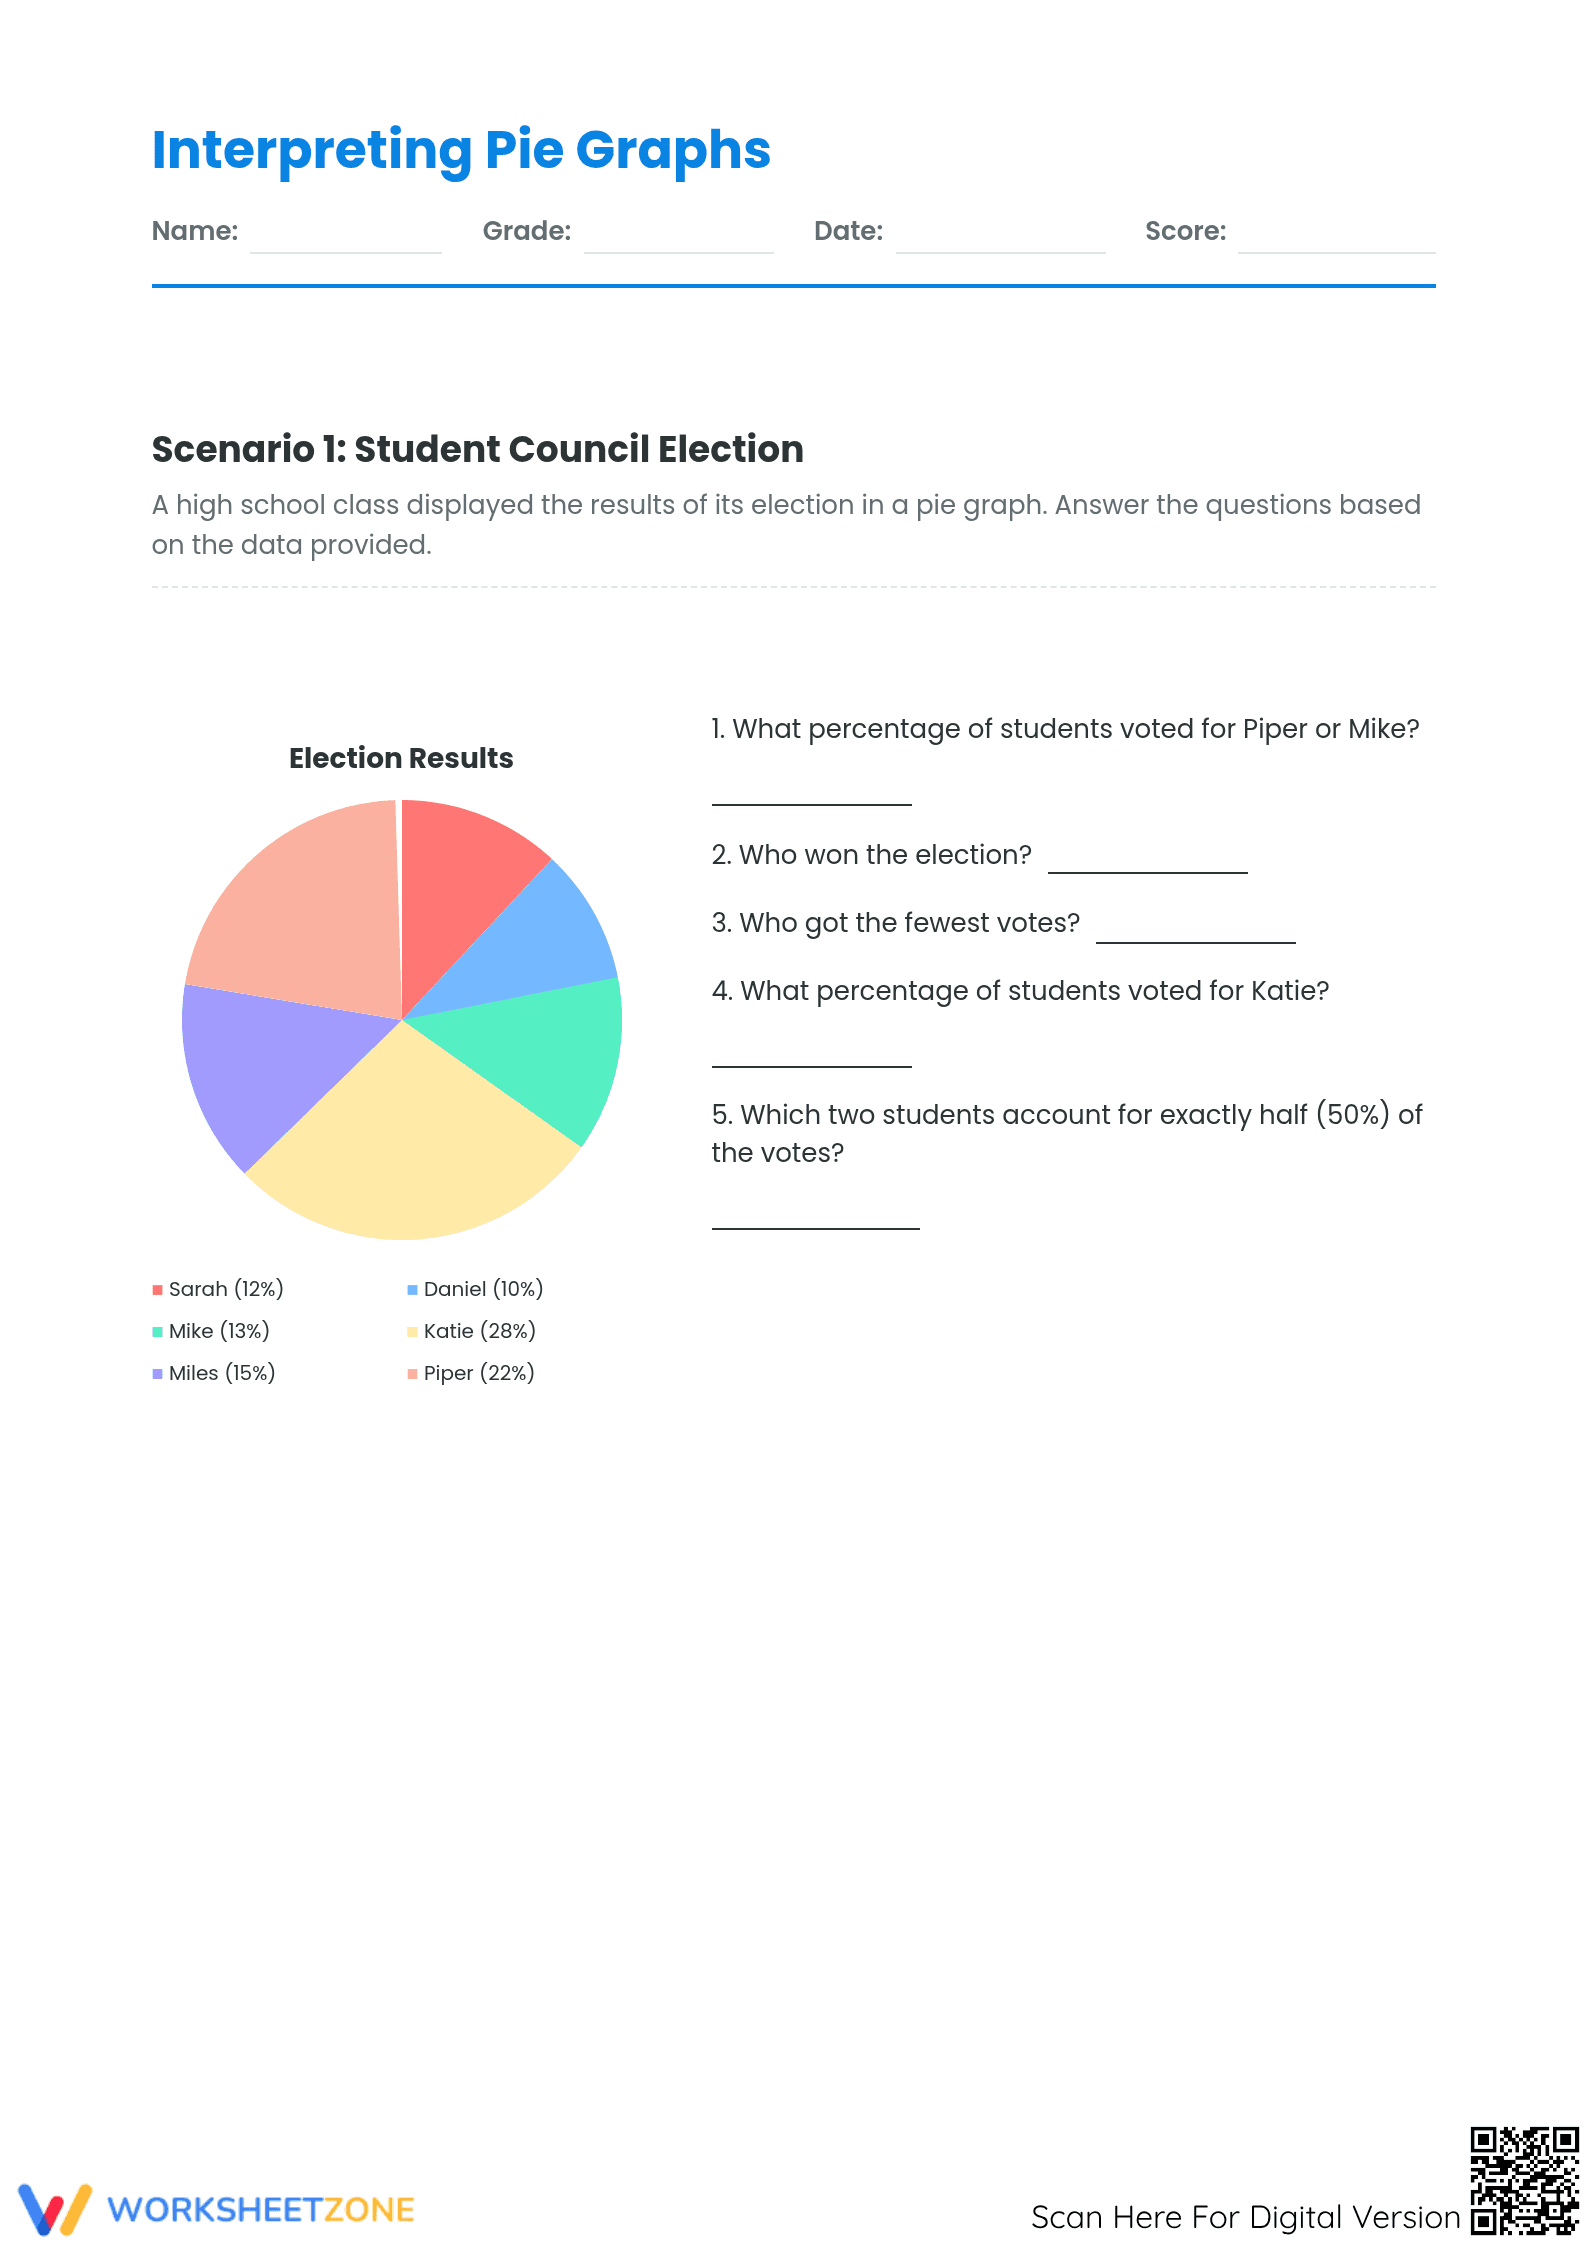
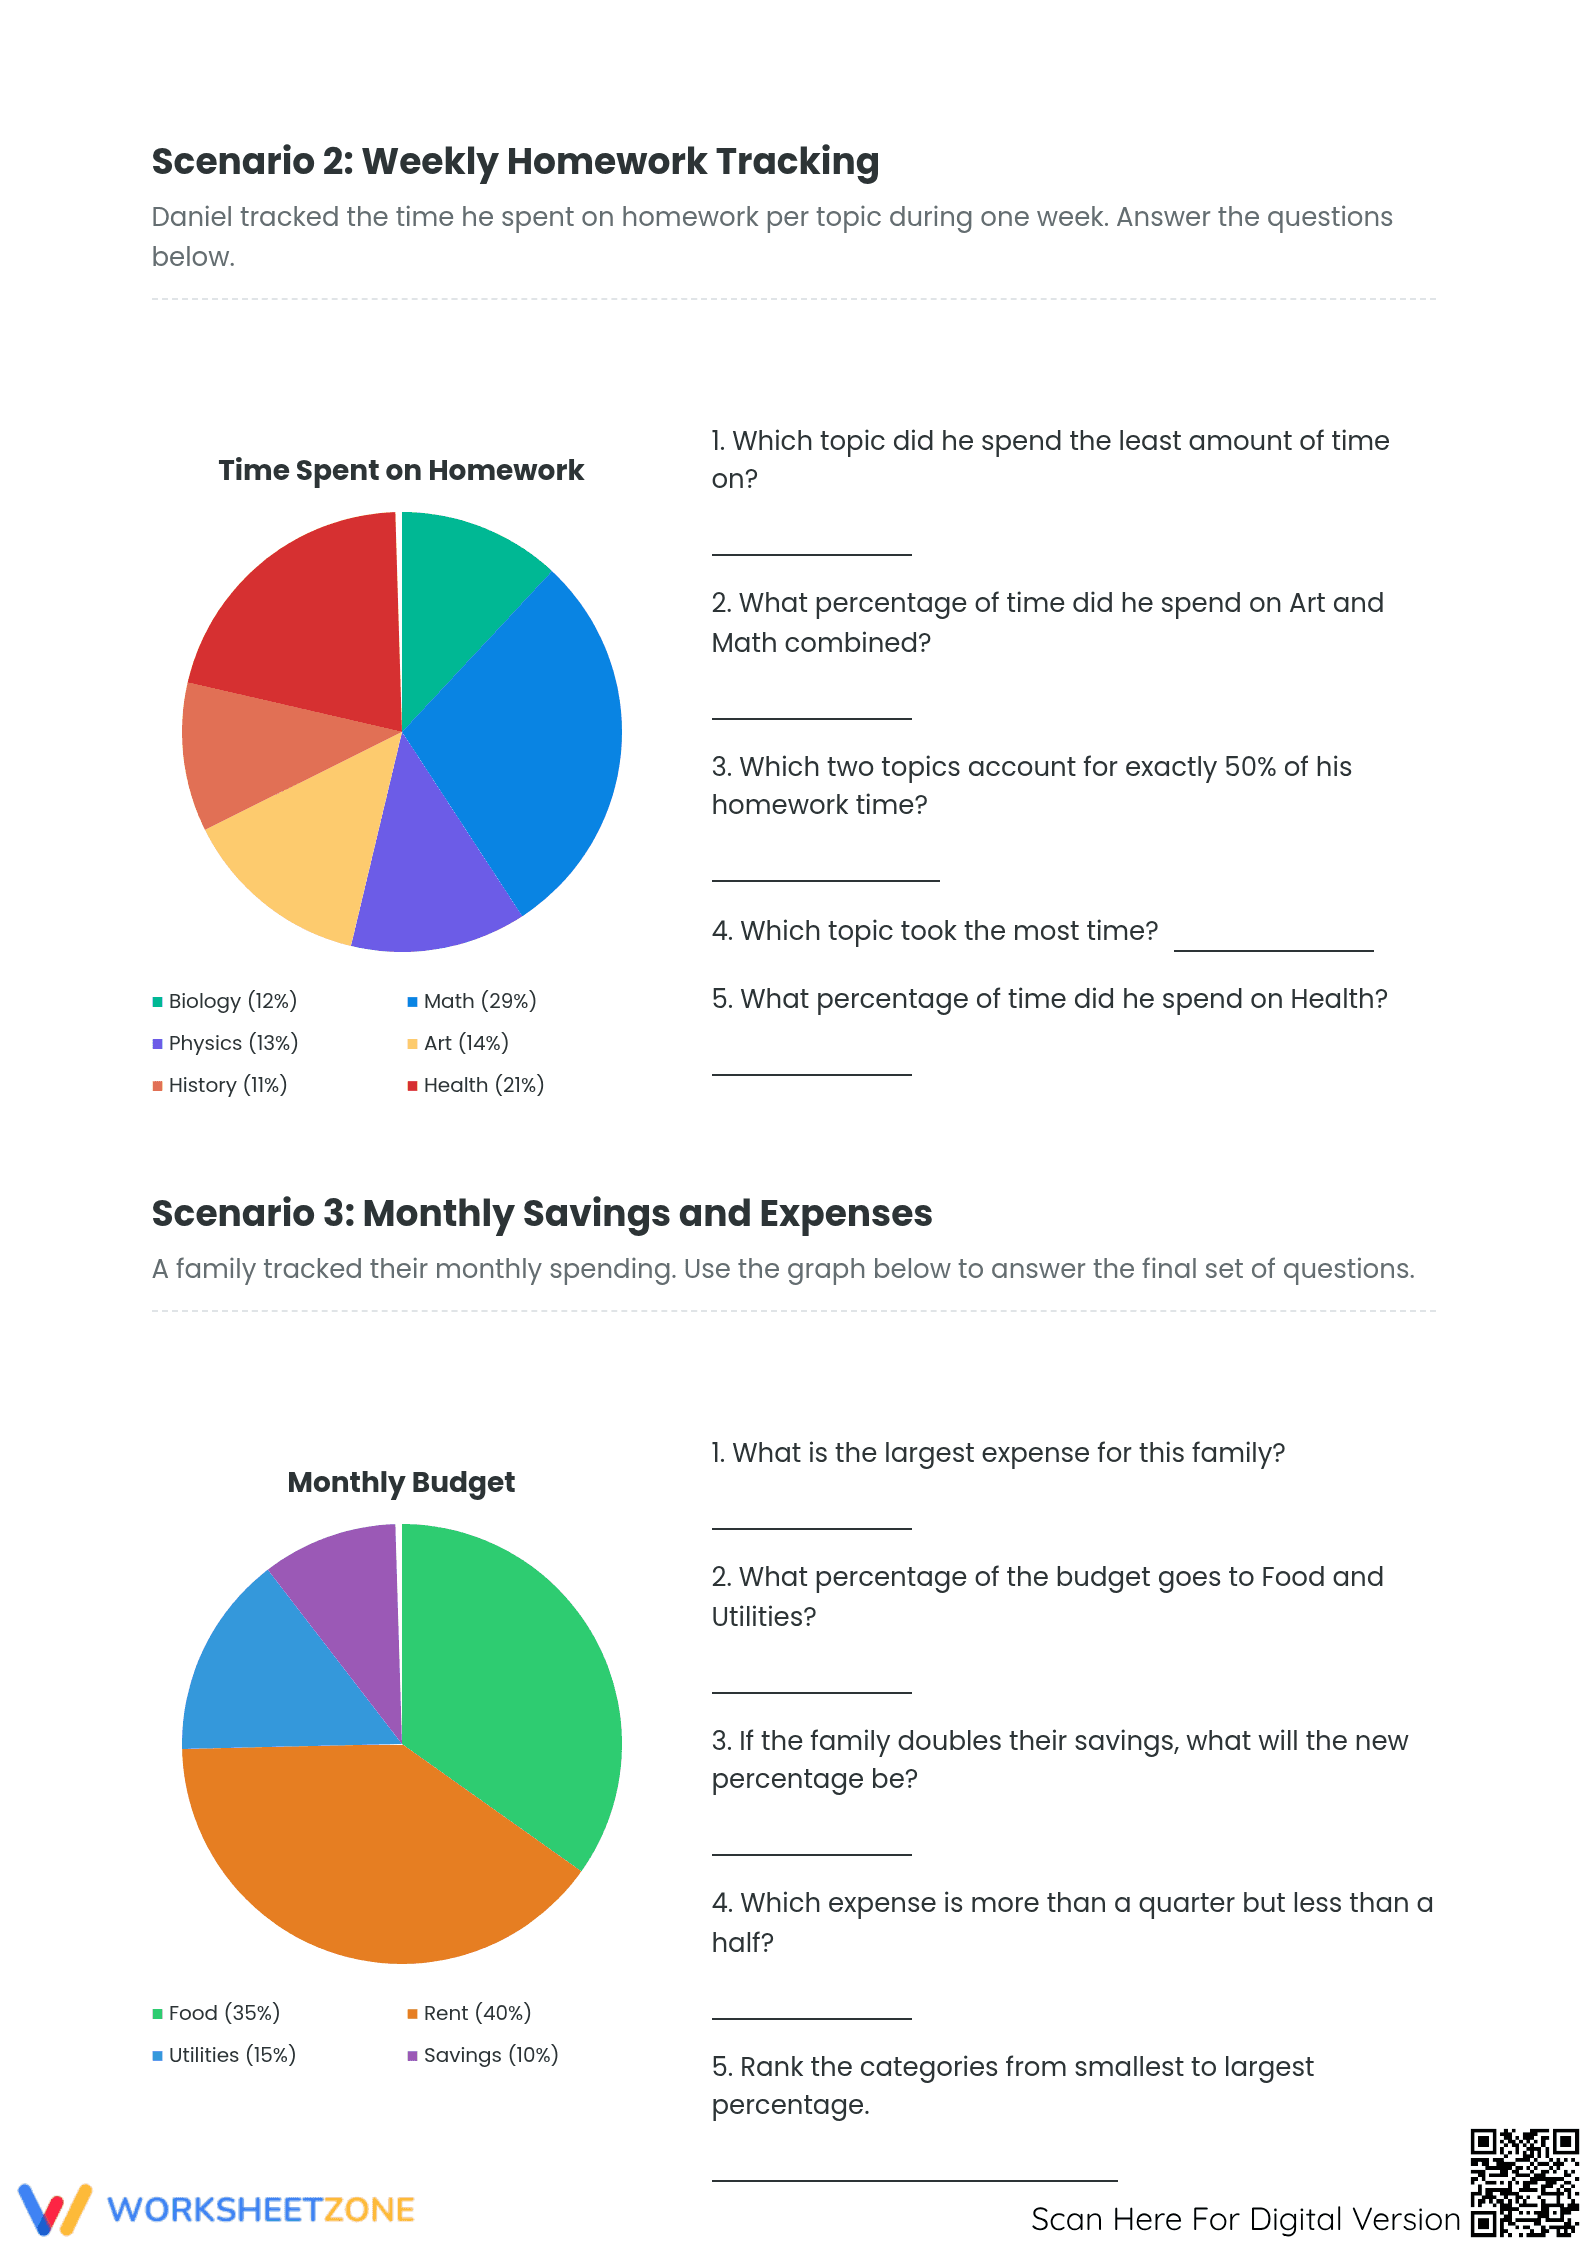
This Grade 6 interpreting pie graphs worksheet provides students with 15 targeted questions to analyze and summarize categorical data. By engaging with real-world scenarios like election results and household budgets, learners develop the critical ability to translate visual proportions into numerical percentages and comparative insights. This resource ensures students can accurately read data visualizations.
At a Glance
- Grade: 6 · Subject: Math
- Standard:
CCSS.MATH.CONTENT.6.SP.B.5— Summarize numerical data sets in relation to their context- Skill Focus: Pie chart interpretation and percentage analysis
- Format: 2 pages · 15 problems · Answer key included · PDF
- Best For: Independent practice or formative assessment
- Time: 20–30 minutes
What's Inside
This comprehensive 2-page PDF features three distinct data scenarios: a student council election, a weekly homework log, and a monthly family budget. Each section contains 5 questions that require students to identify winners, calculate combined percentages, and rank categories by size. The layout is clean and professional, featuring high-contrast charts and a full answer key for rapid grading and student self-correction.
Zero-Prep Workflow
- Print: Generate the 2-page document in less than 30 seconds for your entire class.
- Distribute: Hand out the sheets with no additional instructions needed; the scenarios are self-explanatory.
- Review: Use the included answer key to grade the 15 tasks in under 1 minute per student.
Total teacher preparation time is less than 2 minutes, making it an ideal choice for emergency sub plans or morning bell-ringers.
Standards Alignment
The primary focus is CCSS.MATH.CONTENT.6.SP.B.5, which requires students to summarize numerical data sets in relation to their context. The worksheet also supports 5th-grade foundational skills in understanding parts of a whole and 7th-grade statistics review. Both standard codes can be copied directly into lesson plans, IEP goals, or district curriculum mapping tools.
How to Use It
Assign this worksheet during the independent practice phase of a lesson on data visualization. It serves as an excellent formative assessment to check if students can distinguish between raw counts and percentages. Use the results to identify students who struggle with the concept of "exactly half" or "combined totals." Expected completion time ranges from 20 to 30 minutes.
Who It's For
This resource is tailored for Grade 6 students but is highly effective for Grade 5 enrichment or Grade 7 review. It is particularly useful for visual learners who benefit from seeing data represented spatially. Pair this with a direct instruction lesson on how to calculate the central angle of a pie slice for advanced learners.
According to the RAND AIRS 2024 report, high-quality instructional materials that utilize contextualized data sets significantly improve student retention of statistical concepts. This worksheet addresses the core requirements of CCSS.MATH.CONTENT.6.SP.B.5 by forcing students to look beyond the numbers and interpret the context behind the data distribution. Research from Fisher & Frey (2014) emphasizes that visual literacy, specifically the ability to decode pie charts and percentages, is a foundational skill for middle school mathematics success. By providing 15 specific tasks across three scenarios, this resource ensures that students move from simple identification to complex comparison. The inclusion of an answer key supports immediate feedback loops, which are proven to reduce the formation of mathematical misconceptions during independent practice sessions. This printable PDF is a reliable tool for building data fluency in any modern classroom.


